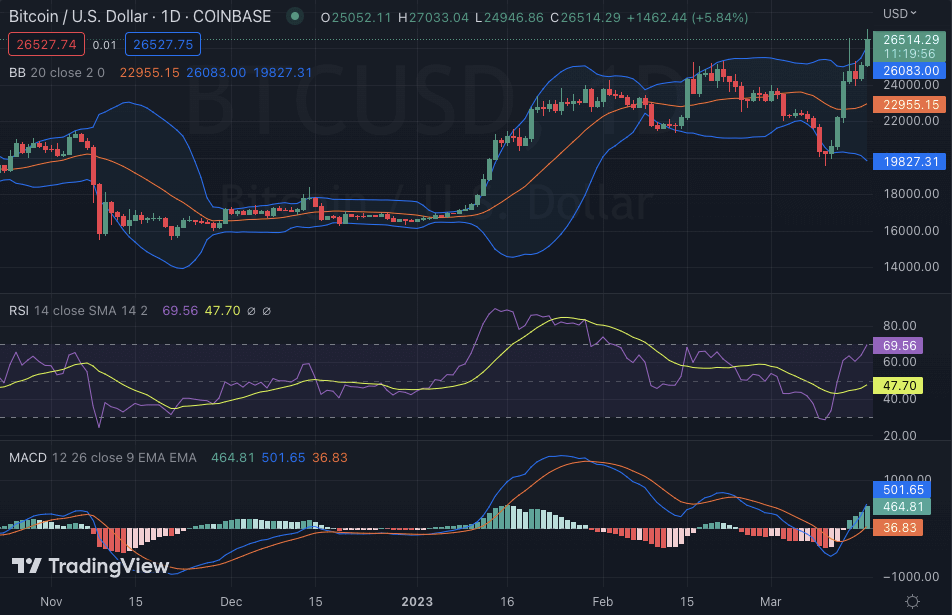
The latest Bitcoin price analysis for today shows a strong bullish surge as BTC/USD rises above $26,000 for the second time this week. Bitcoin is trading in an overall uptrend, with its current price of $26,911 up by 7.35% over the last 24 hours. This positive momentum has been driven by strong buying activity from investors and traders looking to capitalize on the recent upswing in Bitcoin prices.
The next level of resistance that BTC/USD needs to break before further gains are likely is $26,927.81. This resistance line is crucial for the continued bullish momentum of Bitcoin, and a break above this point could signal further price appreciation in the near term. Further support levels can be seen at $24,624.
The gain in Bitcoin price also has been attributed to the Crypto banks such as Silvergate Bank and Signature Bank, which have been supporting the cryptocurrency industry by providing key banking services to exchanges and other crypto-related businesses. This, in turn, has enabled the industry to grow and expand further.
Bitcoin price movement in the last 24 hours: Bulls gain momentum at $26,911
The daily Bitcoin price analysis confirms a strong bullish trend for the market today as the price rallied high during the past 24 hours. The buyers have been in the leading position for the past three days as a continuous improvement in the BTC/USD value was observed. The BTC/USD has gained more than 5.67% in the last seven days as bulls have been successful in maintaining strong momentum.
The circulating supply of Bitcoin has increased to 19,319,956 BTC, and the market cap is around $516 billion, with an increase of 7.23% in the last 24 hours. The dominance of Bitcoin stands at 44% and remains consistent despite the recent gains. The trading volume of Bitcoin has also increased to $42 billion over the last 24 hours, indicating an increase in buying activity.

Looking at the technical indicators, the Moving Average Convergence Divergence (MACD) indicator is in the positive zone. The Bollinger bands are widening, which indicates that there will be increased volatility in BTC/USD for the next few hours. The upper and lower Bollinger bands are at the $26,083 and $19,827 levels, respectively. The RSI indicator is also overbought at the 69.56 levels.
Bitcoin price analysis: BTC curve heads up towards $27,000 as bulls continue to rally
The four-hour Bitcoin price analysis gives the lead to the buyers as well, as the price has been improving since the start of the trading session following yesterday’s bullish lead. The market opened today’s section, trading in a minor bullish at $24,729, and bulls have been increasing their positions since then up until the current price of $26,911.

The volatility in the market is also increasing as the BTC/USD pair has breached many resistance levels in the last few hours. The Bollinger bands on 4-hour BTC are also widening, which means that there will be more volatile price movement in the coming hours. The upper Bollinger band is currently at $26,595, while the lower band is at $23,730. The MACD indicator has been increasing since yesterday and is currently in the positive region. This indicates that bulls have been able to maintain their dominance over the market. The RSI indicator is also overbought, which means the market bulls have been overly aggressive in pushing up the prices.
Bitcoin price analysis conclusion
To sum up, the BTC/USD pair has been on an impressive run over the past 24 hours as buyers have been in a dominant position. The BTC is now touching the key psychological resistance level of $27,000, and if bulls are able to break through this point, further price appreciation is expected in the coming days. The buying pressure is increasing in the market, as reflected by the technical indicators.


