The latest Bitcoin price analysis confirms that a bullish trend has been dominating the charts for the past few hours today. A rise in price has been observed in the last 4 hours as well, which is quite encouraging for the buyers.
The price has been uplifted to the $23,520 level, as the bulls have been successfully maintaining the upwards trend line. Although the price has experienced a downfall this week as well as a strong correction was also observed, the buyers have been able to maintain the bullish momentum and push the price higher.
The price has found good buying interest at $22,861, which is likely to act as a major support should the bulls fail to maintain the momentum. This is an important level for the buyers to keep in mind, as it could lead to a further surge if held. The resistance for BTC/USD is currently at $23,537, and if the bulls manage to break through this level, then we could see further gains for this cryptocurrency.
BTC/USD 1-day price chart: Bitcoin price bounces back to $23,520 as bulls strike back
The 24-hour chart Bitcoin price analysis shows that the price has been able to hold above $22,861 for the most part. The BTC/USD has gained more than 2.50 percent in the last 24 hours and is currently trading at $23,520. The trading volume is still on the downside at $16 billion, while the market cap is at $456 billion.

The technical indicator is also bullish, with the MACD and RSI both pointing upwards. The MACD line is above the signal line which indicates that bulls are in control of the market. The RSI indicator is currently at 53.94, showing that there is a slightly overbought situation in this pair. The moving average (MA) value in the one-day price chart is at the $24034.73 level.
Bitcoin price analysis 4-hour chart: The next resistance target at $24,000
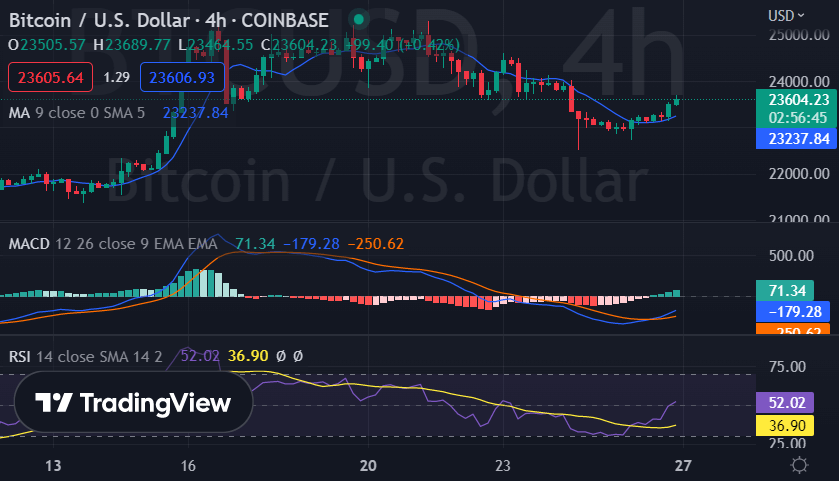
The Bitcoin price analysis on the four-hour chart shows that the bulls are still in control of this pair. The price underwent a decline earlier this week, but now the bullish momentum has been restored. The short-term trending line is moving upwards as the price level is up to $23,520 once again.

If we move on toward the moving average (MA) value, it is standing at the $23237.84 low. The 20-SMA and 50-SMA are both moving above the price level, indicating that the bullish trend is still in place. The Moving average convergence divergence (MACD) indicator is in positive territory, as the MACD line is above the signal line. The relative strength index (RSI) indicator is currently at 52.02, which suggests that there is some room for further gains in this pair.
Bitcoin price analysis conclusion
The latest Bitcoin price analysis confirms that the bulls have resumed their dominance in this pair. The BTC/USD has been able to regain its lost ground and is trading close to the $23,520 level now. A strong support of $22,861 could be a major factor in maintaining the bullish trend. The buying pressure is likely to increase if the price breaks above $23,537.


