Bitcoin price analysis for today looks promising for bulls. The digital asset is trading in the green and is up slightly over 2% from its opening price of $26,621. The BTC/USD has been hovering below $27,000 for most of the day and is now testing the resistance at this level. If bulls can break above this level, then the uptrend could continue toward $27,500. The support level now lies at $26,700. If bears take control of the market and push the price below this point, then BTC/USD could find support near $26,300 before possibly dropping back to its current opening price range ($26,621).
Bitcoin price analysis 1-day chart: BTC draws above $27k after bullish input
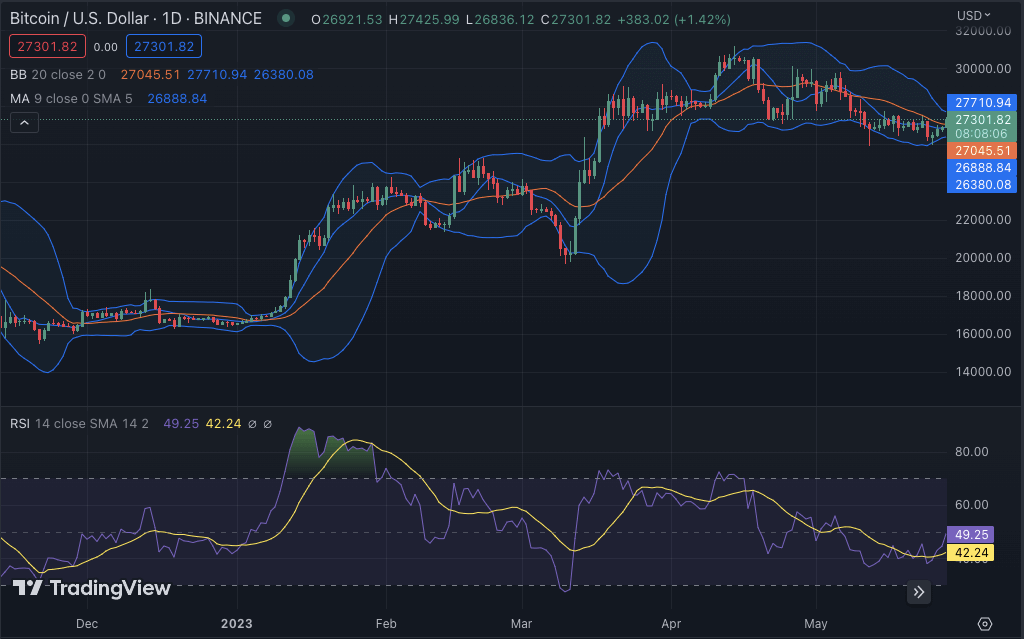
The one-day Bitcoin price analysis is showing support for the bulls today as a substantial amount of rising in BTC/USD value is being observed. This is an encouraging sign for the buyers, as the cryptocurrency faced significant damage in the prior weeks. The price is now retouching the $27,201 mark, and it can be predicted that a further uptrend is coming ahead.

The moving average (MA) value in the one-day price chart is $26,888, which keeps the momentum in play. The 20-day MA is also rising steadily and is currently above $25,482. If the buyers maintain their strength, then we can assume a retest of the previous high ($28,000) soon. The Relative Strength Index (RSI) indicator in the 1-day chart is turning out to be bullish. The value is currently at 42.24, which indicates that the crypto could soon reach overbought levels if buyers continue pushing it upward. The Bolinger bands are also increasing, which could be a sign of the increased volatility that is expected in the coming days.
Bitcoin price analysis: BTC curve ascends to $27,201 after a recent uprise
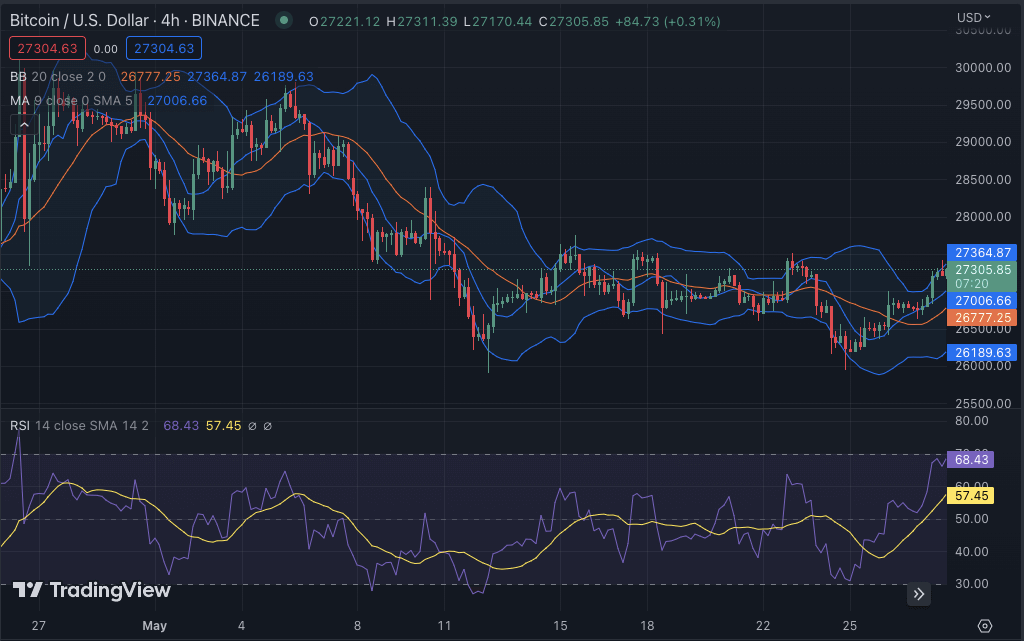
The four hours Bitcoin price analysis is dictating an increasing trend as the cryptocurrency value significantly improved in the last few hours. The short-term trending line is now moving upward because of the constant rise in BTC/USD value. The green candlestick is going higher than the red one, meaning that buyers are getting stronger with each passing hour.

The Bollinger bands on the 4-hour chart are increasing, which could result in more volatility in the near future. The upper band is now at $27,364, indicating that the price could soon reach this level. Similarly, the lower band is at $26,189 and indicates that if BTC/USD falls below this point, then it could go as low as $26,500 in no time. The Relative Strength Index (RSI) indicator is also pointing toward bullish momentum as the value is currently at 68.43 and heading higher. The moving average indicator of $27,000 is also rising steadily and could be a sign of a further uptrend.
Bitcoin price analysis conclusion
Overall, Bitcoin price analysis shows that the bulls are getting stronger as BTC/USD is currently above $27,201. The bullish momentum could push the crypto to even higher levels if buyers keep buying pressure on the market. If bears take control, then BTC/USD could fall back to the $26,500 level.
While waiting for Bitcoin to move further, see our Price Predictions on XDC, Polkadot, and Curve


