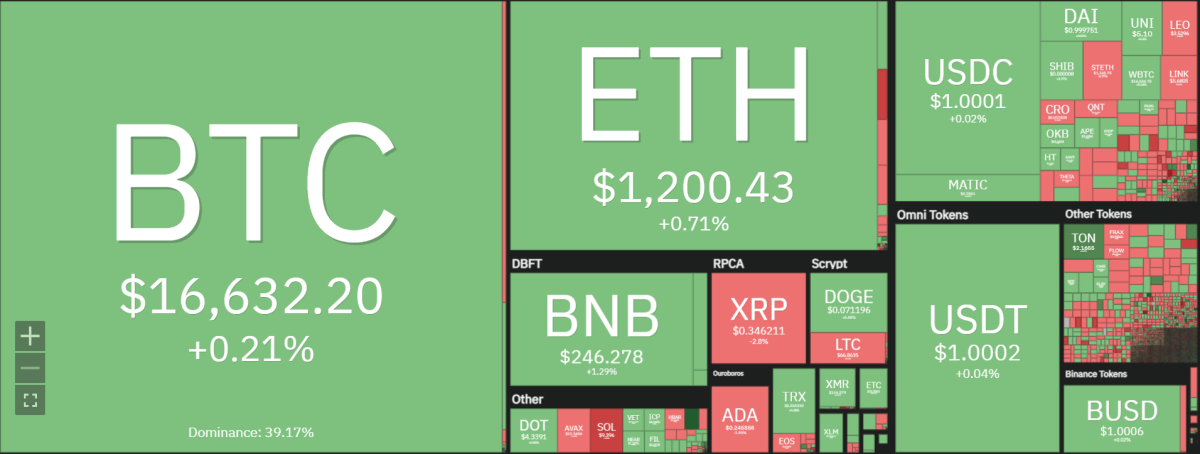
Bitcoin price analysis shows BTC is still trading below the $16,800 resistance and is starting to show signs of weakness. The bears have been pressing the $16,400-$16,500 zone for nearly a week and so far have been able to keep BTC below that level. Bitcoin has been consolidating around these levels as the bulls and bears remain dormant.
The next few days will be crucial as the bulls attempt to reclaim $16,800 and the bears attempt to push Bitcoin below $16,500.If either side is able to break through their respective levels then it could result in a sharp trend reversal. If the bulls are successful, BTC could surge toward its record high of $20,000 which has not been achieved for the last 60 days.

Bitcoin is trading at $16,644.68 and is up by a small figure of 0.10 percent which is very low in comparison to the past few days. It is also trading 0.28 percent below its 20-day EMA of $16,877 indicating a possible bearish trend. Bitcoin’s trading volume has been relatively low at $15.3 billion which is significantly lower than in the past few weeks.
On December 29th, Bitcoin showed a mild resurgence alongside the rebound of stock markets in the United States. The S&P 500 was up 1.4%, and the Nasdaq Composite Index increased by 2.1% while BTC’s short-term price action saw an elevation through US equities’ movement on that day. Unfortunately, this bullish trend is capped beneath $16800 which keeps it from soaring beyond its intraday triumphs.
This year, Bitcoin sky-rocketed to a remarkable milestone with its cumulative transfer volume surpassing the $100 trillion mark; an unprecedented feat that underlines how much people of all nationalities rely on this global settlement network. This is a testament to the trustworthiness and versatility of Bitcoin as it provides users from around the world with secure, cost-effective ways for sending and receiving payments.
Bitcoin is an incredibly secure and reliable global network for payments that have already processed a cumulative transfer volume of over $1 trillion. As more people become aware of the power and reliability inherent in Bitcoin, its transaction volumes continue to climb steadily. Without question, the potential for payment processing with Bitcoin is remarkable.
Bitcoin price analysis on a daily chart: Dormancy continues in the market as BTC is trading within a tight range
The 1-day chart for Bitcoin price analysis shows that Bitcoin is retesting the $16,600 support after wicking below its 20-EMA at $16,877. The RSI for BTC has been steadily declining since December 29th and currently remains around 43 indicating that Bitcoin could go lower if it fails to reclaim $16,800. The MACD also shows a bearish divergence as the Signal line has crossed below the Histogram and is still falling. If Bitcoin fails to break above $16,800 soon then it could be in for further losses.

The SMA50 and SMA100 also indicate a bearish trend as they are both below the current price of $16,644.68.The Fibonacci Retracement level of $16,400 is also a key area to watch as it has been holding strong since December 16th and if Bitcoin fails to reclaim this level then it could see further losses.
The Bollinger bands are contracting and indicating a choppy market as Bitcoin trades within a tight range. The upper Bollinger Band is at $16,945 and the lower band is at $16,236 which is a difference of only 709 points. This indicates that we could see some volatility in the coming days.
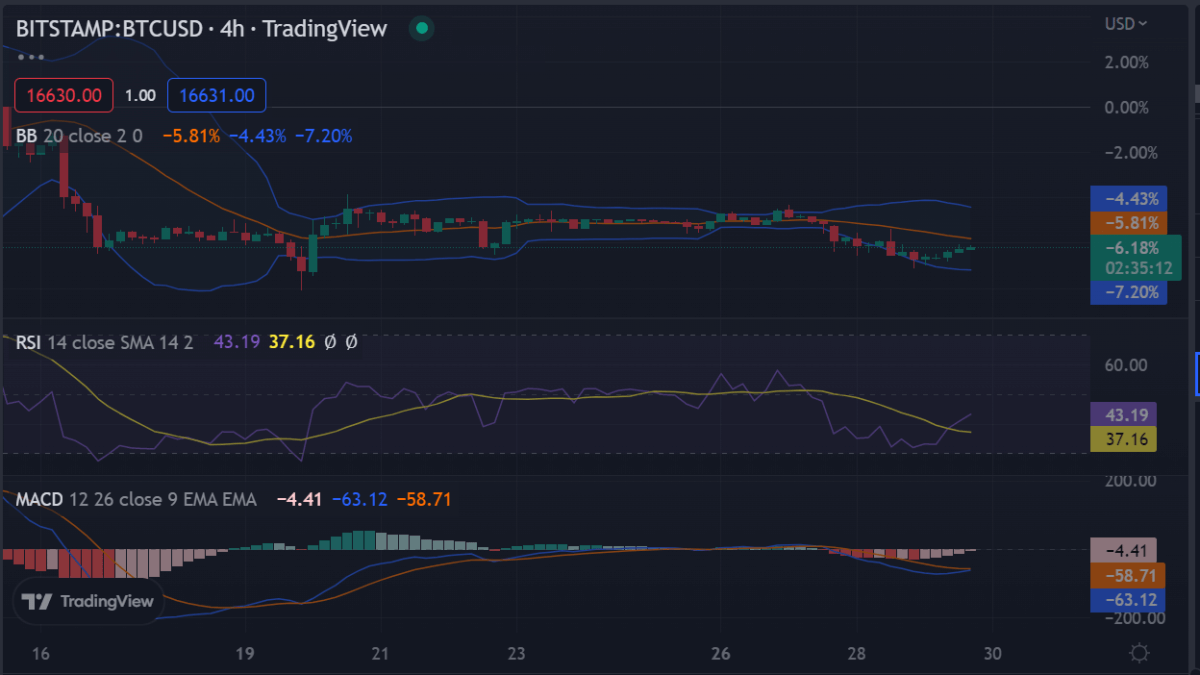
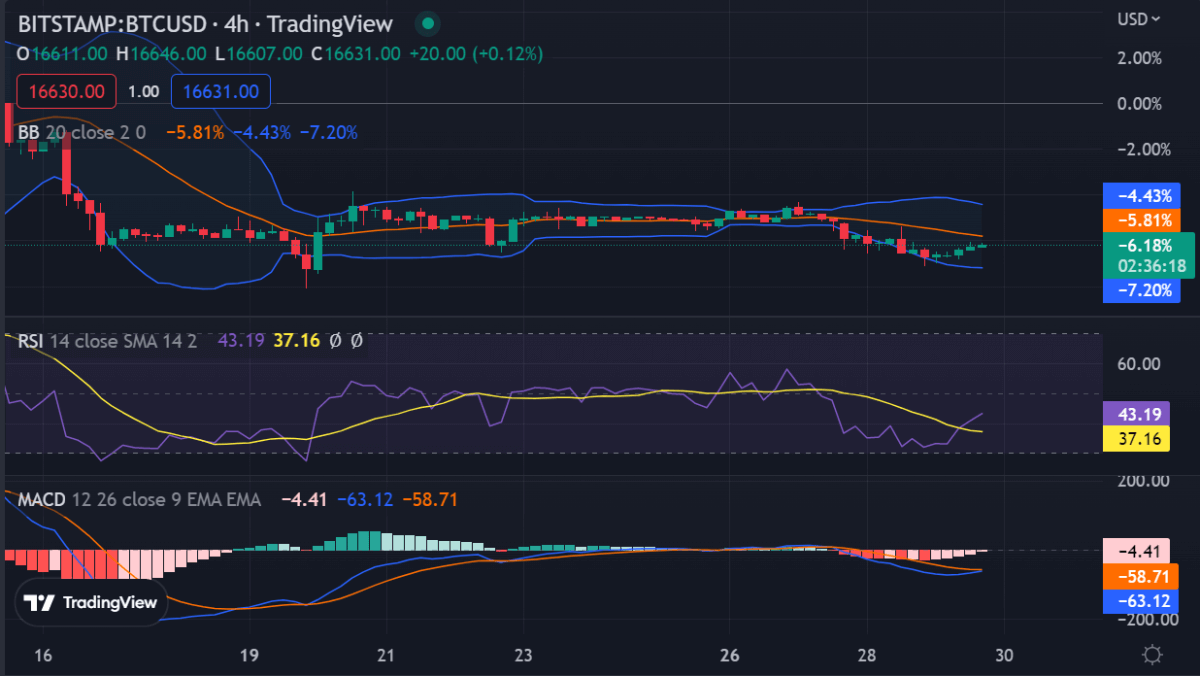
Bitcoin price analysis on a 4-hour chart: Sideways trading persists
Bitcoin price analysis on a 4-hour chart shows the BTC/USD pair formed a horizontal channel between $16,800 and $16,500. The RSI indicator is currently hovering around the 40 mark which shows a lack of momentum in either direction. The MACD has remained neutral with its signal line crossing below the histogram for most of yesterday’s trading session.

The SMA20 and SMA50 remain well above the current price which is a sign of strong resistance. The Fibonacci Retracement level of $16,500 is also an important area to watch as it has been providing support since December 29th and if Bitcoin fails to reclaim this level then it could face further losses.
The Bollinger bands continue to remain in the middle and indicate a lack of volatility in the market. The upper Bollinger Band is at $16,752 and the lower band is at $16,424 which is a difference of only 328 points. This shows that Bitcoin could remain stagnant for some time before any major moves occur.
Bitcoin price analysis conclusion
Bitcoin price analysis shows the market remains trading on a low volatile with Bitcoin still trading within a tight range between the key levels of $16,800 and $16,500.The bears and the bulls have remained low in the past few days and it appears that Bitcoin is likely to remain in a sideways trend for some time.
While waiting for Bitcoin to move further, see our Price Predictions on XDC, Cardano, and Curve


