Bitcoin, the world’s largest cryptocurrency, continues to face a stagnant phase as the recently released Federal Open Market Committee (FOMC) minutes fail to inject much-needed momentum into its price. Alongside this, the broader cryptocurrency market experiences a downturn, with various factors contributing to the prevailing bearish sentiment.
The eagerly anticipated FOMC minutes, which were expected to shed light on the Federal Reserve’s stance toward cryptocurrencies and its potential impact on monetary policies, ultimately left market participants disappointed. The lack of substantial guidance regarding Bitcoin and other digital assets has left investors searching for clarity and direction.
Furthermore, the cryptocurrency market as a whole is grappling with a downturn, prompted by a combination of factors. Heightened regulatory scrutiny, concerns surrounding the environmental sustainability of cryptocurrency mining, and overall market volatility have all contributed to the prevailing negative sentiment.
Amidst this challenging environment, Bitcoin’s price remains in a state of limbo, awaiting a catalyst to break free from the stagnant phase. Traders and investors closely monitor the price action and trading volumes, seeking insights that could guide their decision-making.
As the crypto market seeks stability amidst the current volatility, market participants are anxiously awaiting key events and developments. The expiration of $2.26 billion worth of BTC options further adds to the anticipation and uncertainty surrounding Bitcoin’s price trajectory.
Bitcoin price movement in the last 24 hours: Bears dominate the BTC market as price retraces below $27,000
The 24-hour price chart of Bitcoin price analysis shows a steep decline in the market. The token is struggling to bounce back and is currently trading at $26,312. There appears to be heavy resistance at this level as buyers are unable to push the BTC token beyond it. BTC is down by 1.57% over the past 24 hours and appears to be heading lower if bears remain in control.

The volatility is also quite low in the market, with the Bollinger Bands showing relatively narrow trading ranges. The upper Bollinger Band is currently at $28,430, and the lower Bollinger Band is at $25,952, indicating that volatility could remain low in the market for a while. The moving average indicator is also below the price action at $26,376, further confirming a bearish trend in the market. The Relative Strength Index (RSI) is currently at 38.93, suggesting that the market could remain in a neutral zone for now.
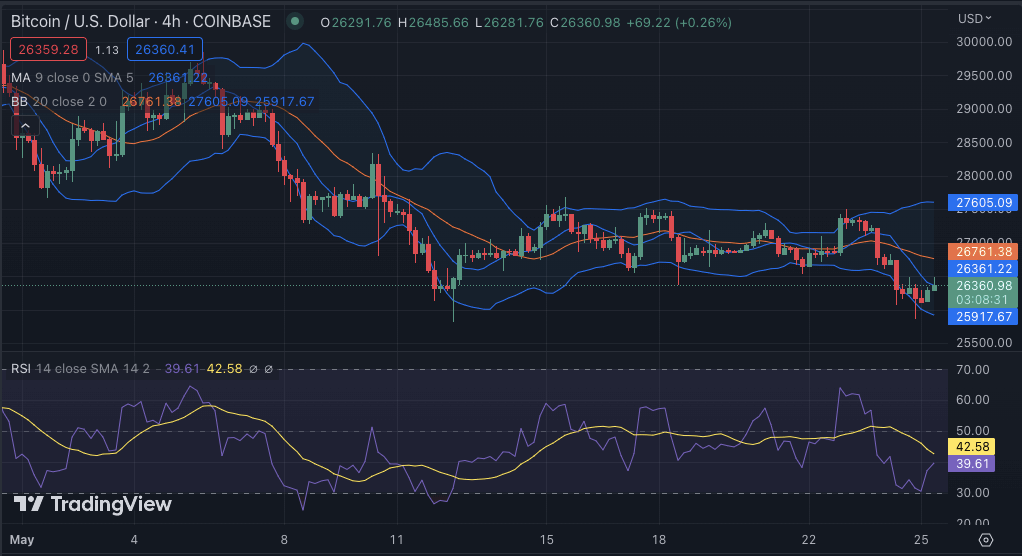
Bitcoin price analysis 4-hour chart: BTC prepares to drop further?
On the 4-hour chart, Bitcoin price analysis is witnessing a steady decline in the market. The support level at $25,890 appears to be the next key target for bearish traders. If that level is breached, it could open up a new range of opportunities for short-sellers in the market. The red candlestick pattern in the 4-hour chart also confirms a bearish trend in the market, with traders expected to remain cautious and seek out opportunities for shorting.

The Relative Strength Index (RSI) is currently at 39.61, which suggests that the market could move lower if bears sustain their pressure. The Bollinger band is also quite narrow, indicating that volatility could remain low in the market. The upper Bollinger Band is currently at $27,605, and the lower Bollinger Band is at $25,917, which suggests that market participants could see some range-bound movements in the coming days. The moving average is at $26,361 and and appears to be heading lower if the bearish trend sustains.
Bitcoin price analysis conclusion
In conclusion, Bitcoin price analysis shows that bears are currently in control of the market, with BTC struggling to break through key resistance levels. The token could face further downside pressure if bears remain in control and lead the market to a new level of volatility. The selling pressure could increase if key support levels are breached, resulting in a further retracement.
While waiting for Bitcoin to move further, see our Price Predictions on XDC, Polkadot, and Curve


