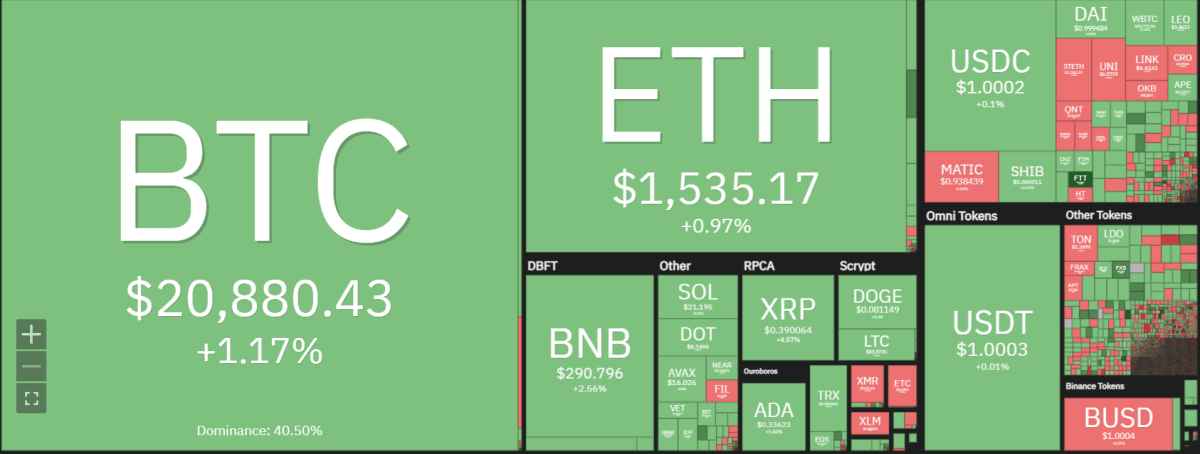
Bitcoin price analysis for today shows the bullish momentum has slowed down somewhat, but the bulls still remain in control.BTC has been holding above $20,000 for some time now and is currently trading at around $20,876.88, up by 0.93 percent.BTC/USD consolidated at $20,800 but failed to tap the next resistance at $21,500. The market may now be looking for support of around the $20,500-20,600 range and could pull back further if that level fails.

Bitcoin has retained new support levels abruptly that it reclaimed in its week-long bull run, so far topping out at $21,650. For now, the market could be entering a period of consolidation as traders await further developments in the market. Despite widespread suspicion over the “choreographed” move, BTC/USD has clawed back key trend lines and psychological price points.
As we look to the near future, Bitcoin price analysis shows that BTC could make a move toward $21,000 in the short term. However, a break above this level would require momentum and strength from the bulls. Otherwise, it has the potential to consolidate further before making any meaningful progress higher. At this point, traders should look out for the BTC/USD pair’s reaction around $20,500-20,600 as it could be a crucial indicator of the trend going forward.
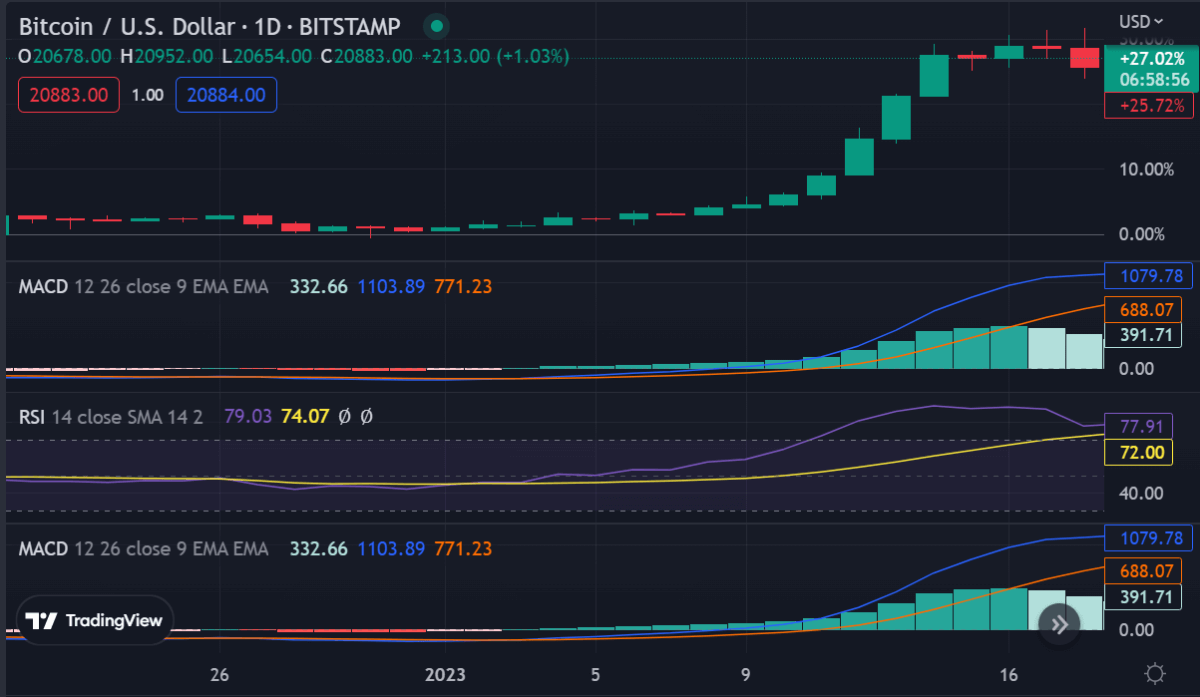
Bitcoin price analysis on a daily chart: BTC stumbles below $21,000
The daily chart shows the BTC/USD pair is struggling to break above the crucial resistance level of $21,500. The bears have stepped in and forced the price back below this level. Bitcoin price analysis on a daily chart shows the BTC/USD has formed a descending triangle pattern and is likely to consolidate in the short term.
Elliott Wave analysis suggests that BTC has entered wave 4 of a corrective wave pattern and is likely to remain range bound. Wave 4, a market trend that we are witnessing in the year 2023, has exceeded its short-term technical levels to reach record highs and accumulate bullish momentum.
According to Elliott Wave Theory, the 20%, 38.2%, and 50% Fibonacci retracement levels are especially important during Wave 4 – Bitcoin already experienced a correction of almost 20%. Consequently, this implies that two additional price targets for BTC will be: $27,100 and $31,850.
The price could retrace back to around $19,800 before the bulls step back in. Bitcoin might gain another 50% before seeing a mass sell-off to complete its bear market, with a key support level of $17,000.
The technical analysis for the BTC/USD pair shows BTC’s price is trading above the 50-day moving average, which is a bullish sign. Additionally, the RSI (Relative Strength Index) has moved off its overbought territory, currently hovering at around 71 levels. The MACD line is well placed above the red signal line, an indication that the bulls are still in control of the market.

The weekly candle closed in the green, another sign that the bulls have not been completely taken out of the market.
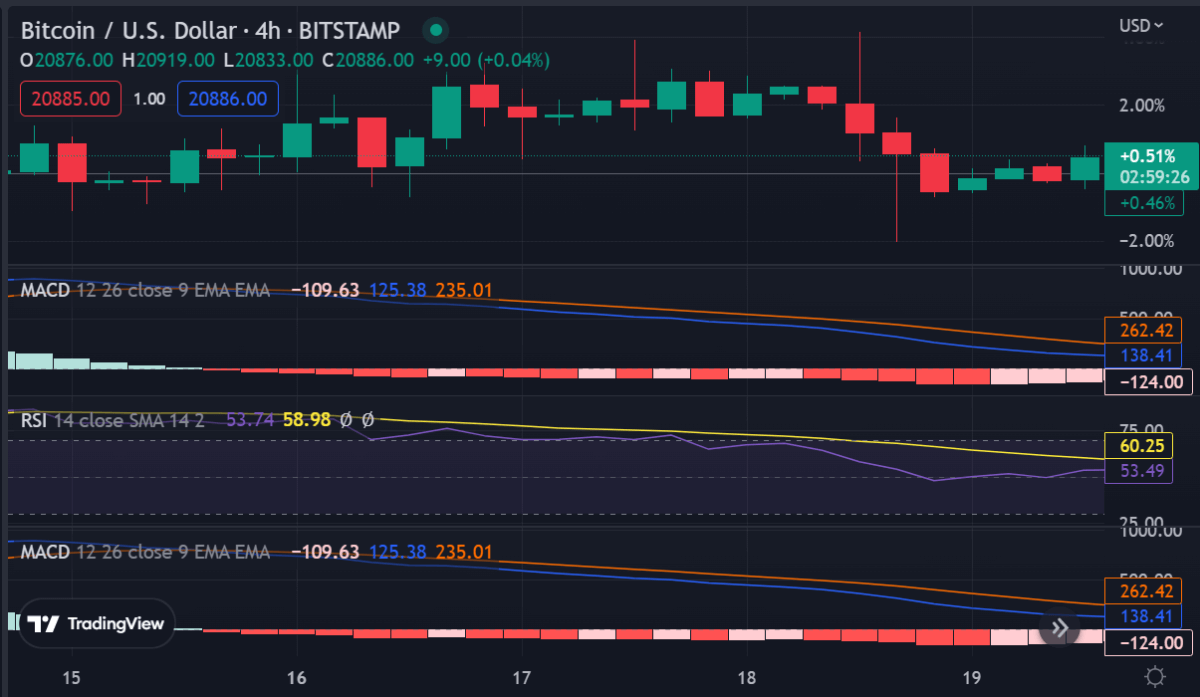
Bitcoin price analysis on a 4-hour chart: Bearish divergence
On the four-hour chart, Bitcoin price analysis shows signs of bearish divergence as the Relative Strength Index (RSI) has declined towards 50 levels. The MACD line is below the red signal line and if the bearish momentum continues, BTC could decline further toward $19,800.However, the daily candle close above the $21,000 level could keep the pair afloat in the short term.

If a bullish candle closes above the key resistance level of $21,000 could be a sign of further upside momentum. In this case, BTC might break out of its consolidation phase and aim for the next target of $27,100. On the other hand, a bearish candle close below $20,500 may increase the chances of bears entering the market and pushing the price lower. Moreover, if the BTC/USD pair falls below $19,800 in the next few days, it could indicate that a correction is on its way.
Bitcoin price analysis conclusion
In conclusion, Bitcoin price analysis shows that BTC has found some stability above $20,500-20,600 and could maintain its current range in the short term. However, a break above $21,000 would be needed to initiate the next bullish wave and target $27,100. If the bears take control of the market and push BTC below the $19,800 support level, then it is likely that a deeper correction could be on its way.
While waiting for Bitcoin to move further, see our Price Predictions on XDC, Cardano, and Curve


