Bitcoin price analysis shows the king coin opened the weekly charts on a downward trajectory, as it fell below $17,000 after losing that level to a downward movement last week. In the last 4 hours, Bitcoin has formed an ascending trendline bounce and has managed to reclaim the lost $17,000 level. However, the bulls are stumbling to defend this level and it may take some time before we see a sustainable move toward the $19,000 level.

Bitcoin is trading at $17,012.30, down by 0.96 percent after some buying interest was observed at the $17,000 level. The global average is exposed to a range-bound move until it struggles to break above $17,200 or below its range low of $16,600.
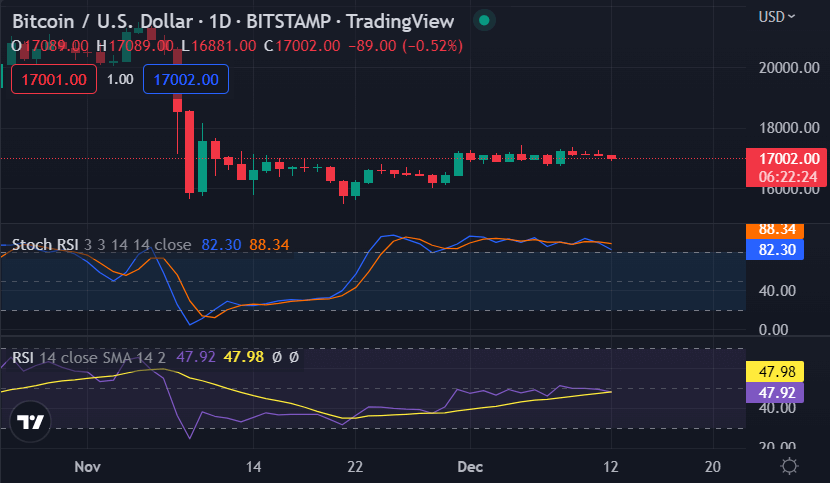
Bitcoin price analysis on the daily chart: Bears dominate
Bitcoin price analysis shows that the bears continue to dominate the market, pushing prices lower and preventing any sustained rallies. Over the past several hours, BTC has been unable to push through the key resistance levels, and it remains unclear when this downward trend will reverse.

The current support levels are at $16,300 and $15,500. The resistance levels are at $17,200, $18,000, and then the all-time highs above $19k. Bitcoin has remained above the 200MA on the daily chart and is still trading in a bearish zone. The MACD indicator has turned bearish, which signals that further declines are possible.
The Relative Strength Index (RSI) is in the bearish sentiment as it resides at the 47 level on the daily chart. This suggests that BTC is oversold, but it has not been able to reverse its course.
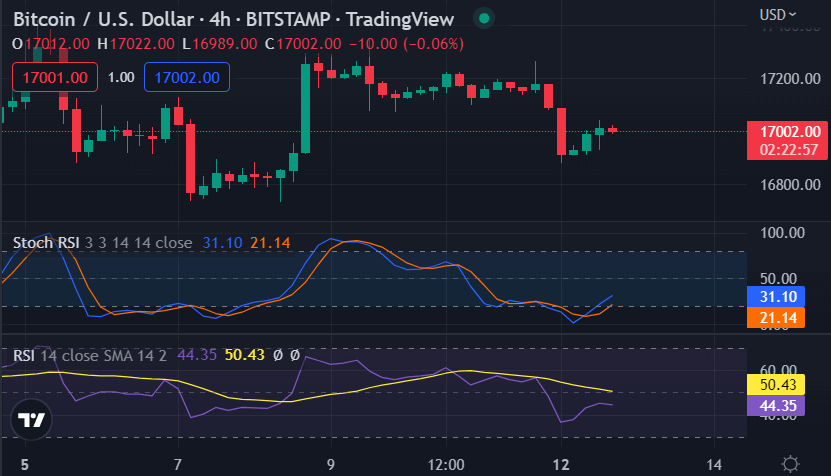
Bitcoin price analysis on a 4-hour chart: BTC consolidates around $17,000
Bitcoin price analysis on the 4-hour chart shows that BTC is trading in a slight bullish trend after it broke out of the wedge. The BTC/USD pair broke through several key resistance levels and managed to reach as high as $17,243 before settling around its current value of $17,009.56. There appear to be bullish signs as the crypto has formed a double-bottom pattern at $17,000.

BTC is currently consolidating before it makes its next move. It could either push through the $17,200 level or go back to test the support levels of $16,300 and $15,500.
Bitcoin’s outlook remains largely bearish near-term, but it does appear to be having a short-term bullish bias. The prices are expected to move sideways for the next 24 hours, as traders wait for more catalysts that will push the market northward.
Bitcoin price analysis conclusion
Bitcoin price analysis shows that BTC could make another move up in the near term, with the potential to reach as high as $18k or even higher. On the downside, the bears might heighten their pressure and push it to the support levels of $15,500 and $16,300.
While waiting for Bitcoin to move further, see our Price Predictions on XDC, Cardano, and Curve


