The latest Bitcoin price analysis reveals that the market is gradually climbing higher. The buying pressure on the BTC token has intensified as it surged to $27,845, with a gain of 2.20%. The Buying pressure is likely to increase even further as buyers look to capitalise on the current market momentum. The bull had hit an intraday high of $28,432 earlier today when the buying pressure heightened; however, the token failed to break beyond that level. The next level to watch for BTC will be around $29k as more buyers come into the market expecting further gains. The current support level lies at the $27,192 mark, and if the buying pressure can hold up above that level, then we could see a new all-time high for BTC tokens very soon.
Bitcoin price analysis 24-hour chart: BTC struggles to break the $29k resistance
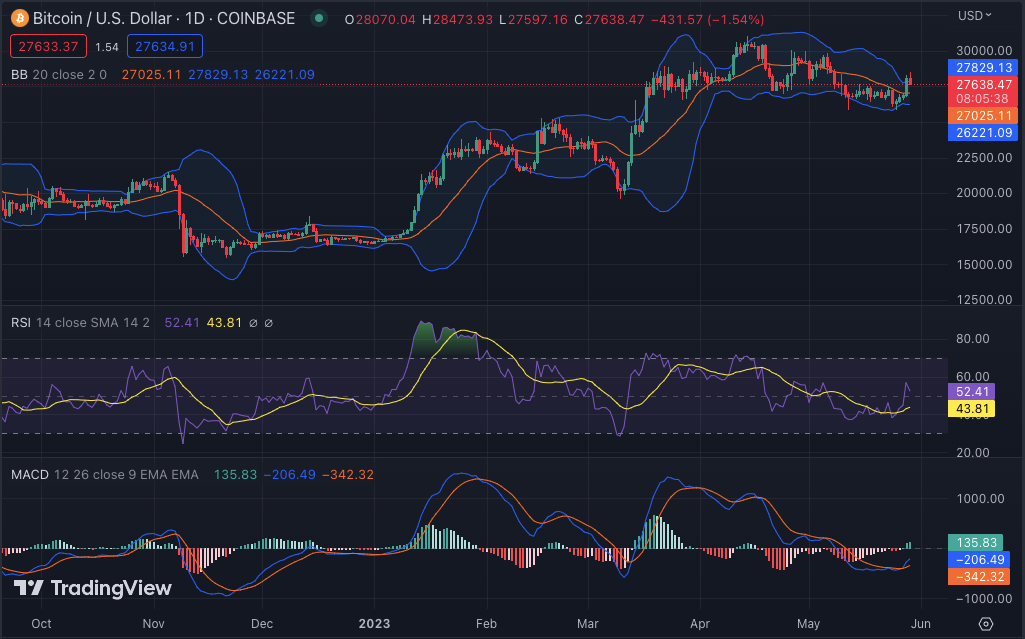
The daily chart for Bitcoin price analysis also highlights the upward trajectory of the price, and further increases in momentum may be seen over the course of the day. However, there is still some resistance on the upside, around $28,432. The market cap has also surged by nearly 2.35 per cent and is now at $535 billion. The 24-hour trading volumes have also increased by more than 65 per cent and are now at $16.65 billion. Thus, with further buying pressure coming into the market, we could see a break beyond the current resistance levels and hit a new all-month high in no time.

Looking at the daily chart for the coin, the price is moving above the 20-day simple moving average (SMA) and the 50-day SMA. This indicates that buyers are in control of the market, and the uptrend is likely to continue. The volatility in the market is also increasing, and this sentiment could be seen in the Bollinger bands widening. The upper Bollinger band is at $27,829, while the lower Bollinger band is at the $26,221 level. The RSI for the coin is at 52.41, which shows that it is currently near the overbought region and could face a pullback in the near future.
Bitcoin price analysis 4-hour chart: Bullish recovery is on the way as price levels rise
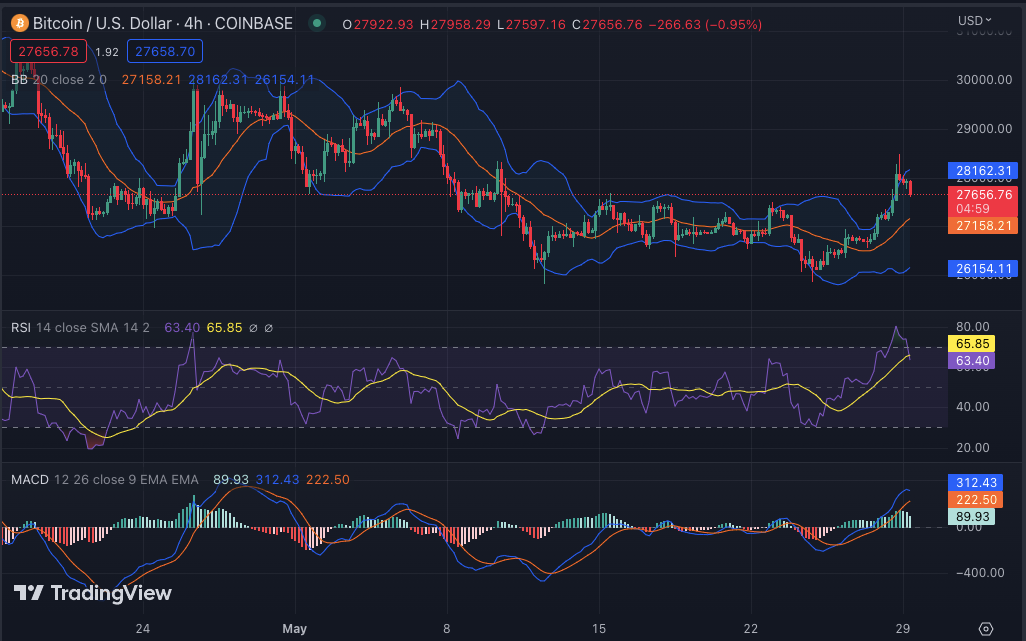
The 4-hour chart for Bitcoin price analysis shows that the bulls are currently in control. The past week’s bears witnessed significant price swings, which have now cooled down. The bulls have been able to maintain the upper hand as the price has managed to stay above the 20-day SMA and the 50-day SMA. BTC has been trading in a tight-range-bound zone since the start of the day, with resistance at $28,432 and support at $27,192.

The MACD is also moving upwards and could break above 0 soon. The histogram is also green, which indicates that the bulls are in control. The RSI for the coin is currently at 63.40, which shows that the buyers are still in charge. The Bollinger bands are expanding, indicating increasing market volatility. The upper Bollinger band is at 28,162 while the lower Bollinger band is at 26,154; both could act as resistance and support levels, respectively if there is a price pullback.
Bitcoin price analysis conclusion
Overall, the Bitcoin price analysis shows that the bulls are likely to maintain control in the short term and push prices higher in the coming days. The buying pressure is likely to increase further as investors continue to capitalise on the current market momentum. The next level to watch for Bitcoin will be around $29k, and if it manages to break that resistance, then we could see a new all-time high very soon.
While waiting for Bitcoin to move further, see our Price Predictions on XDC, Polkadot, and Curve


