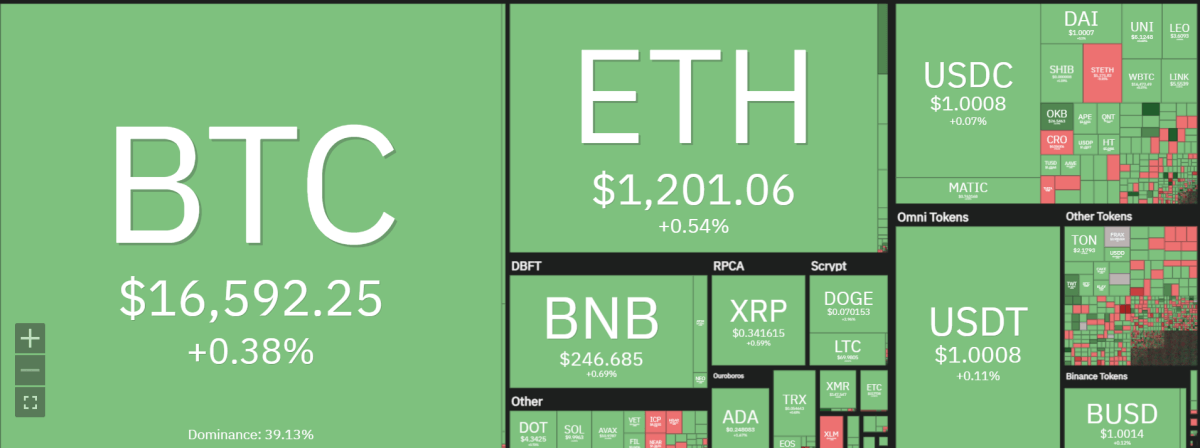
Bitcoin price analysis of the last day of 2022 shows Bitcoin’s price has settled above $16,500 following a week of low volatile trading. Bitcoin has formed higher lows and higher highs as the price dips, but then quickly recovers to surpass a high of $16,650 on Friday. The price is currently trading at around $16,592.65 after facing rejection at the $17,000 level.

Bitcoin’s price has been held captive within a tight band between the 50-day moving average and an ascending trendline. Since this range is crucially important, whichever direction it breaks could decide the mid-term trajectory of Bitcoin. As 2022 is coming to an end, Bitcoin has not seen any major price movements and will likely stay in its current status. Thus, traders should be prepared for a lack of exciting trends as the year draws to a close.
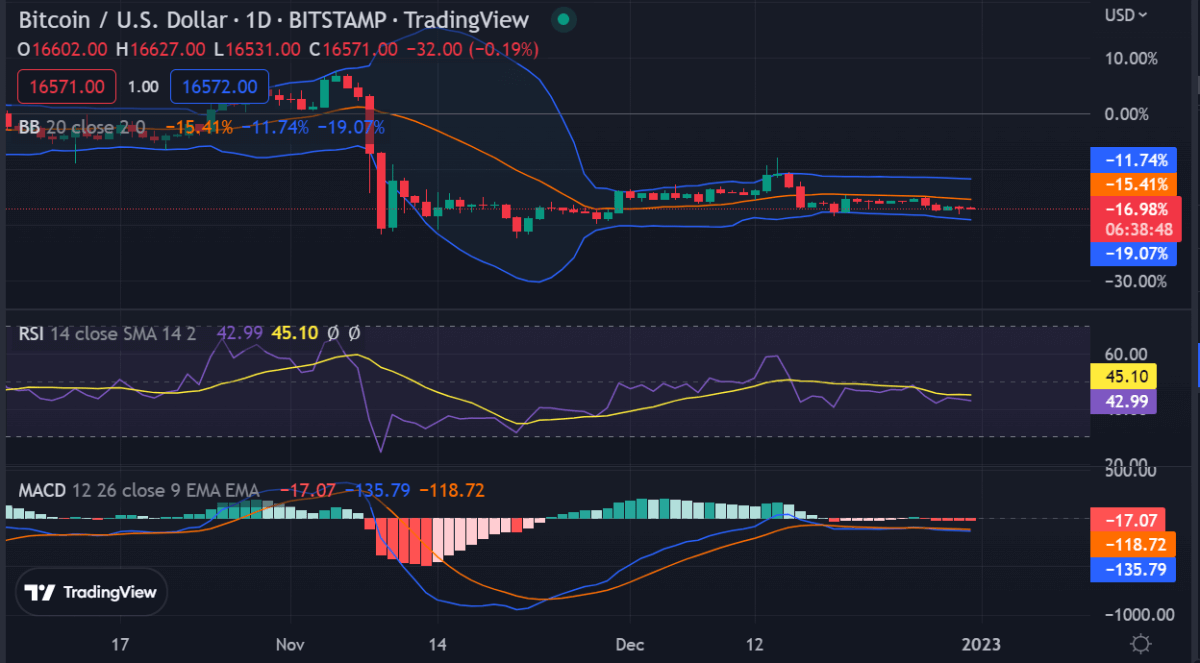
Bitcoin price analysis on a daily chart: Bulls defend $16,000 support
The latest Bitcoin price analysis points to a bullish breakout with the $17,000 level being critical for further upside. To that end, it is important to note that BTC’s price has sought support at $16,000 on multiple occasions in recent months. This suggests that this region has become an important long-term support zone for Bitcoin and could be a potential area for further bullish momentum.

However, even if the bulls manage to break through the $17,000 resistance, Bitcoin could still be entering a consolidation phase. This means that BTC’s price could remain range-bound between crucial support and resistance levels for some time as traders take stock of their positions and wait for the market to make its next move. In such a scenario, traders should be wary of further downside pressure if the $17,000 resistance proves too strong to break.
The current resistance level is at $17,000. If Bitcoin manages to break this level, it could see some buying pressure and move toward $17,000. On the downside, if the price falls below the 50-day moving average and the ascending trendline, it could enter a consolidation phase. In this case, traders should be prepared for lower trading volumes and tight ranges in the coming days.
The technical indicators are showing neutral to bullish signals, with the Relative Strength Index (RSI) at 45.13 and the Moving Average Convergence/Divergence (MACD) line starting to move upward.
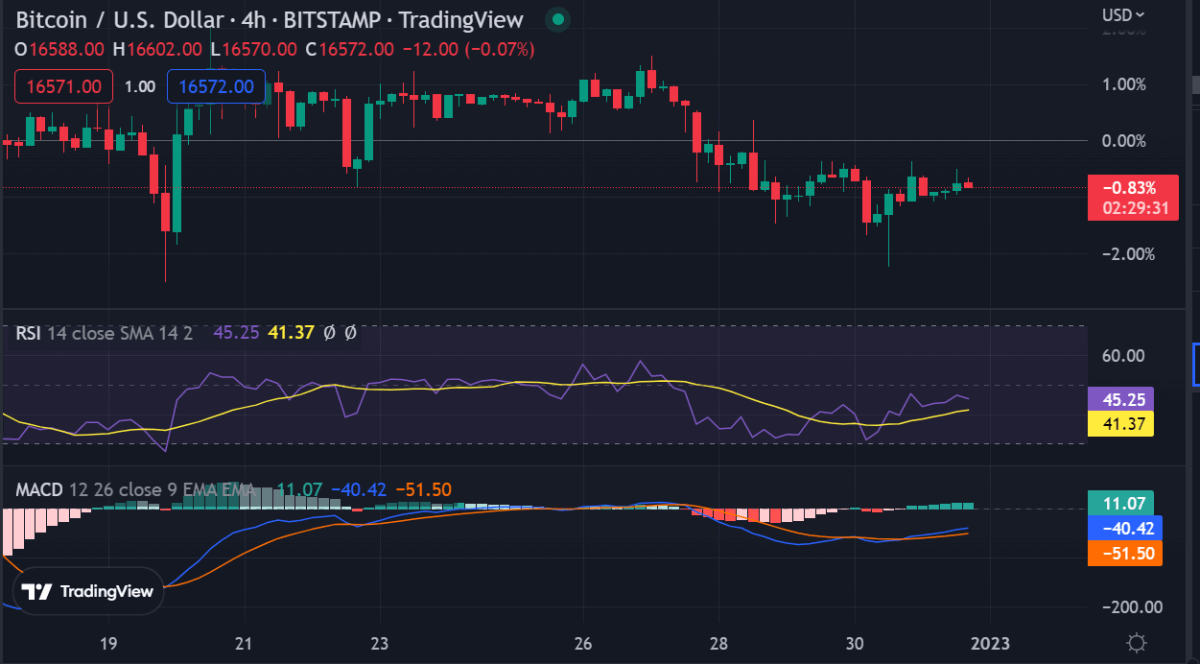
Bitcoin price analysis on a 4-hour chart: Slight bullish bias
Bitcoin price analysis on a 4-hour chart is showing a slight bullish bias, with the 50 Simple Moving Average (SMA) line providing support near $16,400. The RSI is currently at 44.03 and looks to be slowly moving above the neutral zone. The MACD histogram has also started to move higher and could further confirm a bullish breakout in the coming days.

The Stochastic Oscillator is currently in the overbought region, so there could be some bearish pullback in Bitcoin’s price. With the EMA200 line providing dynamic support near $16,200, traders should be prepared for a possible retracement if the current bullish bias does not hold.
Bitcoin price analysis conclusion
Overall, Bitcoin’s price analysis looks bullish as it is trading above $16,500 with significant support near $16,000. The main resistance remains at the psychological level of $17,000 and if Bitcoin manages to break this level, it could move higher toward $20,000.
While waiting for Bitcoin to move further, see our Price Predictions on XDC, Cardano, and Curve


