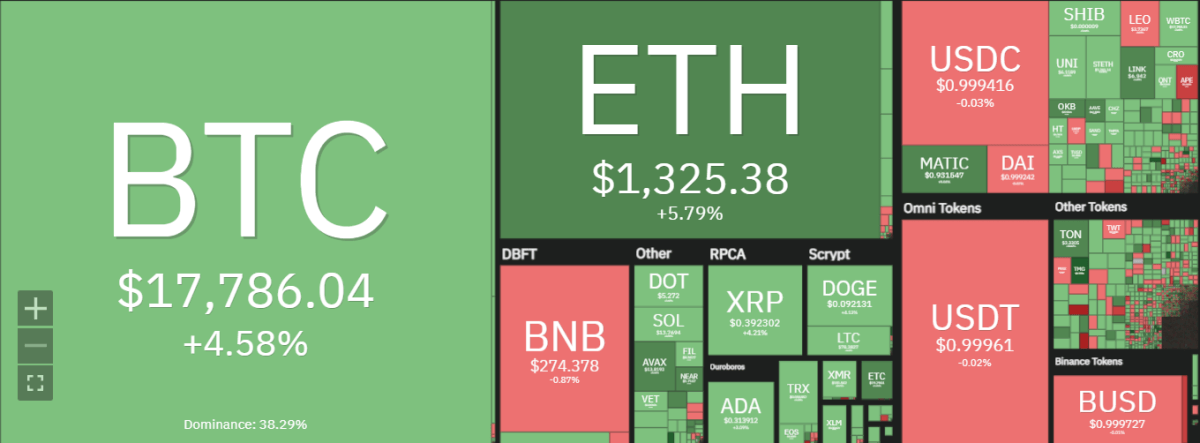
Recent Bitcoin price analysis reveals the cryptocurrency is making a strong move higher as it approaches the $17,700 level. The price spike has evolved after a period of consolidation of around $17,000. There has been heated speculation that BTC had reached its bottom ($17,000) and a bullish breakout was imminent.

The move higher has been met with strong resistance at $18,500, which is a key level for BTC if it is to further advance above its previous resistance of $20,00 before a sharp decline following the FTX contagion that led to the November market turmoil.
On the downside, the key support level is at $17,000. If Bitcoin fails to hold above this level, a further correction could be in the cards. Overall, Bitcoin price analysis shows that the cryptocurrency is in a strong uptrend as it looks to challenge the $18,000 level.
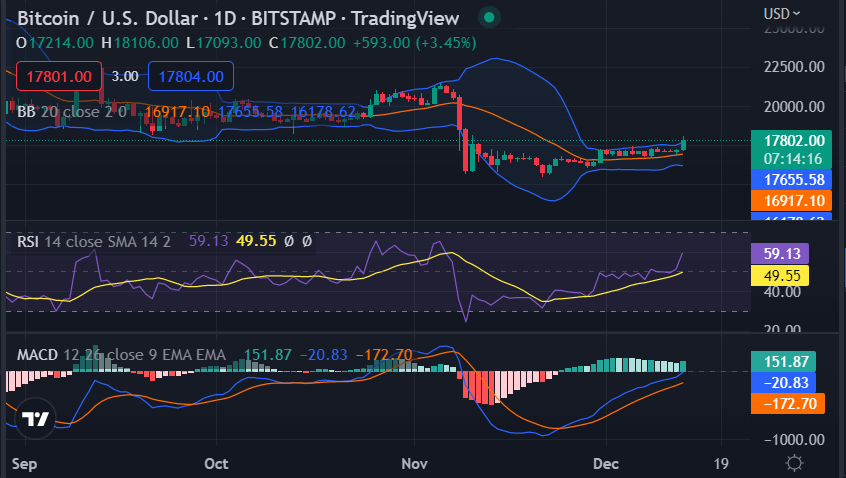
Bitcoin price analysis on a daily chart: Bulls push BTC back above $17,500
The daily chart for Bitcoin shows a strong uptrend as the bulls push the cryptocurrency to break above the previous resistance of $17,500. The key level of support is at $17,000 and if the bulls can hold above this level then further upward momentum is expected. The RSI indicator is currently at 66, which suggests that the market is still in overbought territory. The MACD indicator is also above the zero line, indicating a positive trend.

Bitcoin is currently exchanging hands at $17,792.24 after opening the daily trading session at a $16,997.97 low and registering a high of $17,811.91. BTC is up by 4.61% since the opening of the day’s trading session.
Further technical indications show the price is well above the 200MA, indicating that the bulls are in control and likely to push higher.
If Bitcoin is able to break through the $18,500 resistance level it could signal a strong move higher. However, if the bulls fail to break through this level then there is a risk of a correction, and Bitcoin could retrace back toward $17,000.
Bitcoin price analysis on a 4-hour chart: Bullish continuation
Bitcoin price analysis on a 4-hour chart shows a very strong bullish trend as the cryptocurrency looks to break above $18,000. The key level of support is at $17,500 and if the bulls can hold above this level then further upward momentum is expected. The RSI indicator is currently at 70, which suggests that the market is in overbought territory. The MACD indicator is also above the zero line, indicating a positive trend.

The market volatility is high as the Bollinger bands are bulging out. This indicates that the market is in a state of euphoria and could be subject to sharp pullbacks if support levels are broken.
Bitcoin price analysis conclusion
To sum up Bitcoin price analysis, the cryptocurrency is currently in a strong uptrend as it looks to challenge the $18,000 level. The daily chart shows a strong bullish trend with indicators pointing towards further upward momentum and if the bulls can hold above the $17,500 support level then more gains are expected. However, a minor pullback could emerge as traders might profit take and the market volatility is high. It is important to note that the $18,000 resistance level could be a major hurdle for Bitcoin and if it fails to break this level then a correction could be on the cards.
While waiting for Bitcoin to move further, see our Price Predictions on XDC, Cardano, and Curve


