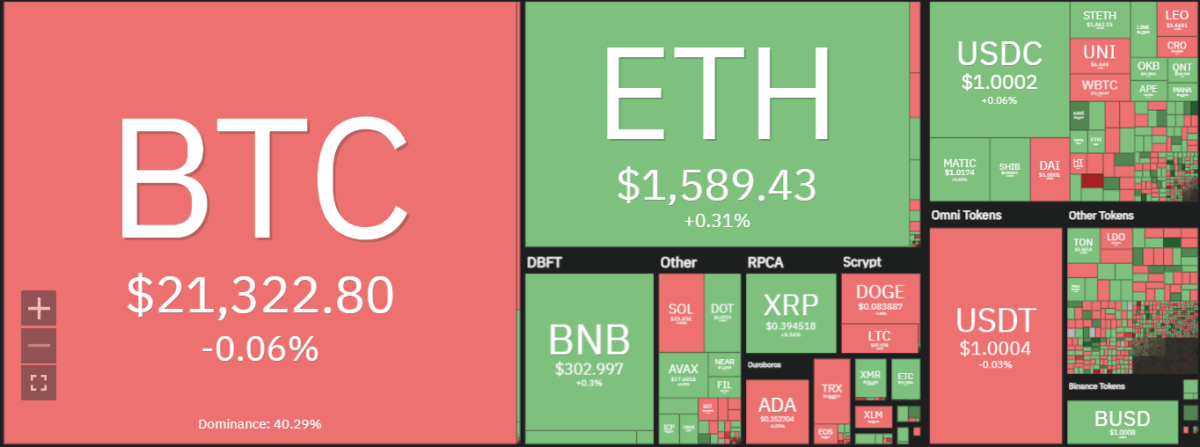
Recent Bitcoin price analysis shows BTC is in a strong upward trend. The price of BTC surged from a low of $20,978 to its current peak of $21,262. This marked a 1.00% increase in the last 24 hours, Furthermore, bullish is gaining momentum and BTC is likely to reach higher highs.

Bitcoin has had a strong performance recently and is currently one of the most popular cryptocurrencies in the market. In fact, BTC has recorded a price surge of 22.54% over the past 7 days and has outperformed the market by a wide margin. This is likely attributed to increased optimism from investors who are betting on a bullish market.
However, BTC faces strong resistance at $21,438, which means that the bullish rally may slow down in the near future. Despite this, it looks like the bullish sentiment is still strong and BTC could continue to rise if support holds.
As of now, Bitcoin’s market capitalization stands at $410 billion and its daily traded volume is around $25 billion. This shows that there is still optimism among investors despite
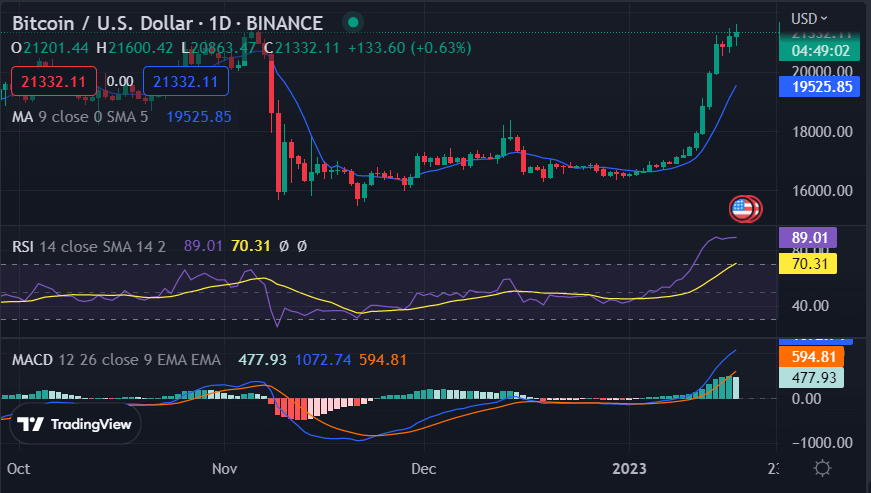
BTC/USD 1-day price chart: Cryptocurrency keeps improving as bulls show momentum
The 1-day Bitcoin price analysis shows an increase in price today as the bulls are performing really well if compared to other coins, with the price reaching the $21,262 level. Overall, Bitcoin is entering a bullish phase and this could be the start of a strong rally. While there is resistance at $21,438, if support holds at $20,978 then BTC/USD may continue to rise. The buyers are in control and the bulls are showing momentum.

The moving average convergence divergence (MACD) indicator shows that Bitcoin’s price is likely to continue surging in the near term. Lastly, the relative strength index (RSI) remains level and suggests that there may be more room for a further rally toward $70.31 in the coming sessions.
Moreover, the moving average lines are currently trending higher, which points to a robust bullish trend in the near term. The 200-day moving average line is also starting to trend higher, and this could give a further boost to the cryptocurrency’s price action.
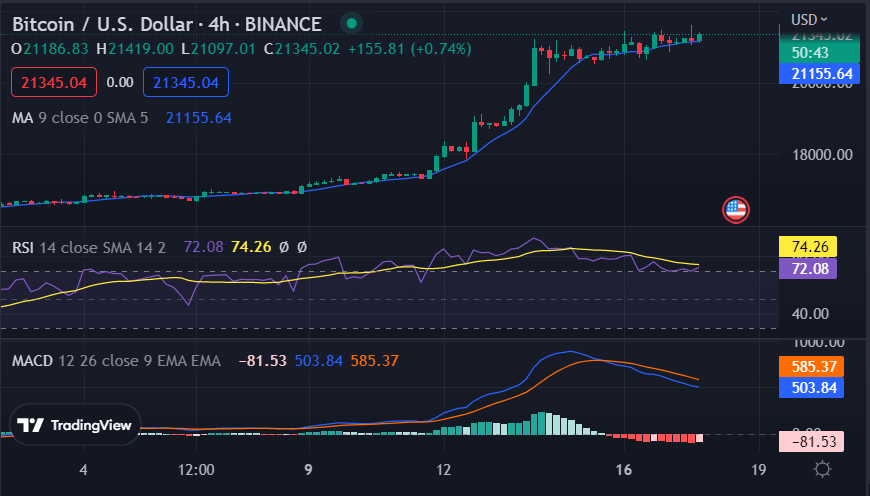
Bitcoin price analysis 4-hour chart: Strong uptrend continues
The 4-hour Bitcoin price analysis indicates a high increase in the price level as the price is now touching $21.262 due to the strong bullish activity of today. Currently, the price is corrected, but the correction is expected to be on the lower side as a correction was also observed late at night, which could not last long, and the current correction might end with the same result.

The moving average on the 4-hour price chart is present at $21,155 and suggests that the correction won’t be significant. The MACD has crossed over to the bullish side, which is a positive sign for BTC/USD. On top of this, the RSI is moving up and shows more room for gains if support holds at $20,978.
Bitcoin price analysis conclusion
Overall, Bitcoin price analysis points towards an upward trend in the near term, and bullish investors are likely to benefit from such a move. However, volatility is still high and there could be some pullbacks along the way. Investors should keep an eye on the $20,978 level as it will determine the direction of BTC/USD in the coming sessions.
While waiting for Bitcoin to move further, see our Price Predictions on XDC, Cardano, and Curve


