
Market forces are at play as Bitcoin consolidates at the $70,000 mark, signaling an imminent breakout. At press time, Bitcoin was 3% shy of registering a new all-time high. The high record was made following market hype, which led to Bitcoin halving. Bitcoin halvings have historically been bullish.
Also Read: Bitcoin Volatility: Is accumulation and low volatility the last stages before a big market move?
This article analyzes Bitcoin’s movements on the charts and examines fundamentals that will inspire the next breakout. Will Bitcoin reach $100k?
Bitcoin Daily Chart: Bitcoin breaks the May price range
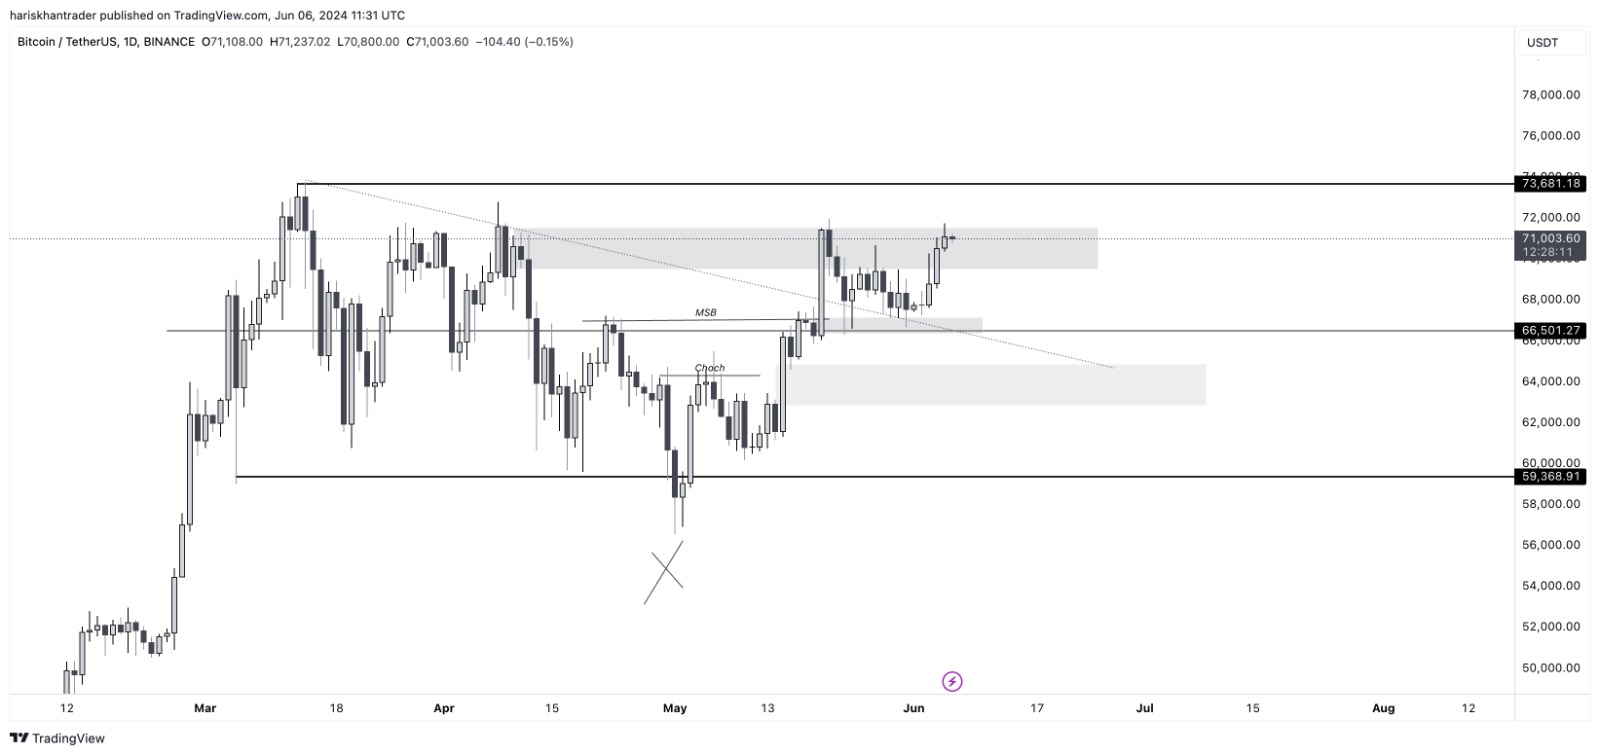
Bitcoin closed May’s range liquidity as it crossed above $71,000. The move was a show of strength as bulls dominated the market.
Also read: Semler Scientific buys $17M Bitcoin, plans $150M fundraise for more BTC acquisition
Before closing May’s range, Bitcoin broke above two other critical ranges—the low and the mid-range—in the span of one week. The records mean that Bitcoin is now back to its annual high. It registered its all-time high on Mar 14, 2024 at $73,750.
Bitcoin Weekly Chart: Bitcoin repeats historical pattern
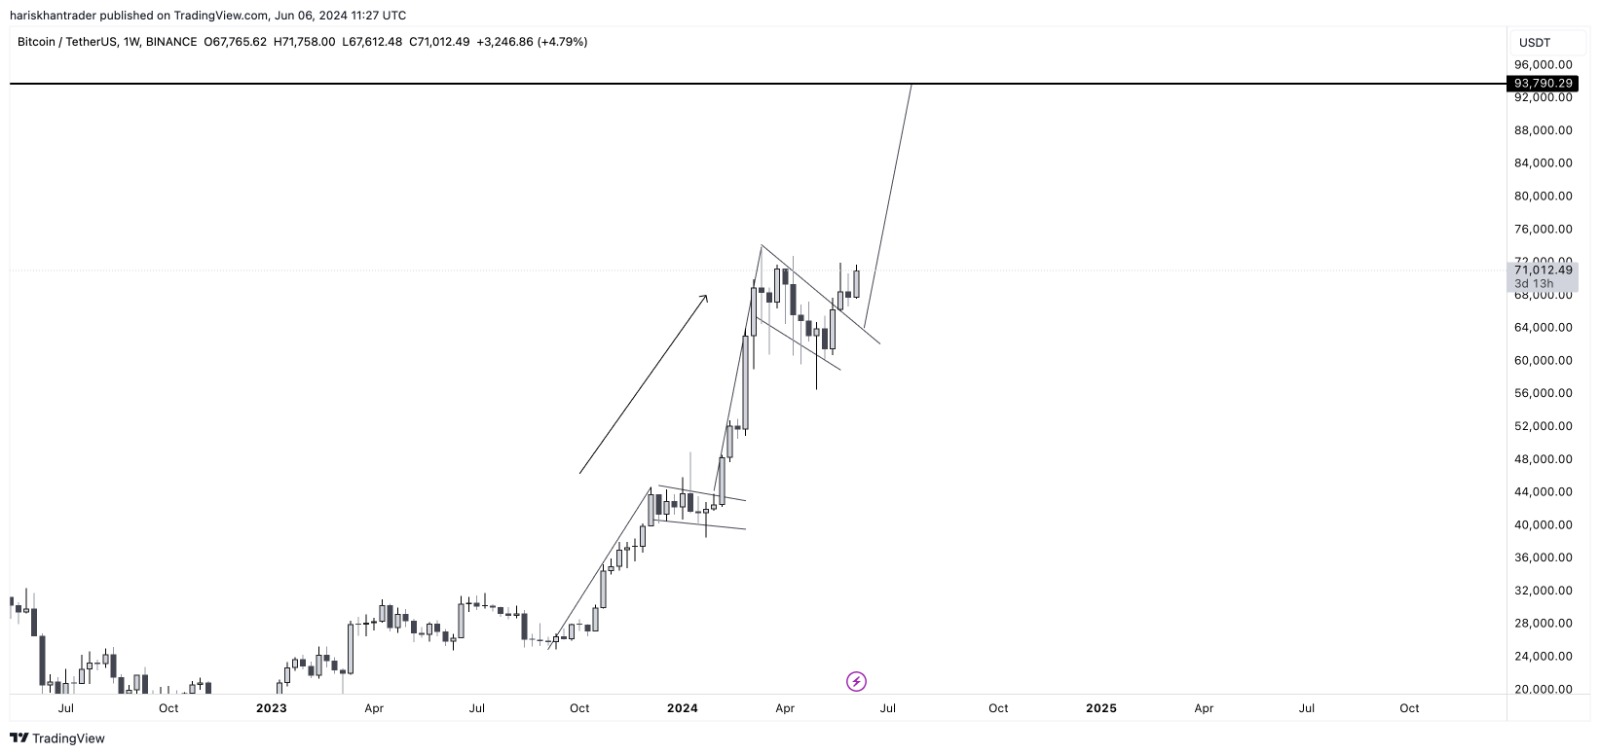
The weekly chart highlights the formation of bullish flags in previous weeks. The phenomenon is better explained by the market, which moves in two phases: expansion and contraction. Expansion occurs when the market breaks out from consolidation, which could be in either direction. Contraction refers to the state of consolidation. Longer periods of contraction have historically resulted in extended breakouts. It is like a balloon: the longer you squeeze it, the higher the probability of it bursting.
Looking at the chart, Bitcoin is breaking out from the contraction phase.
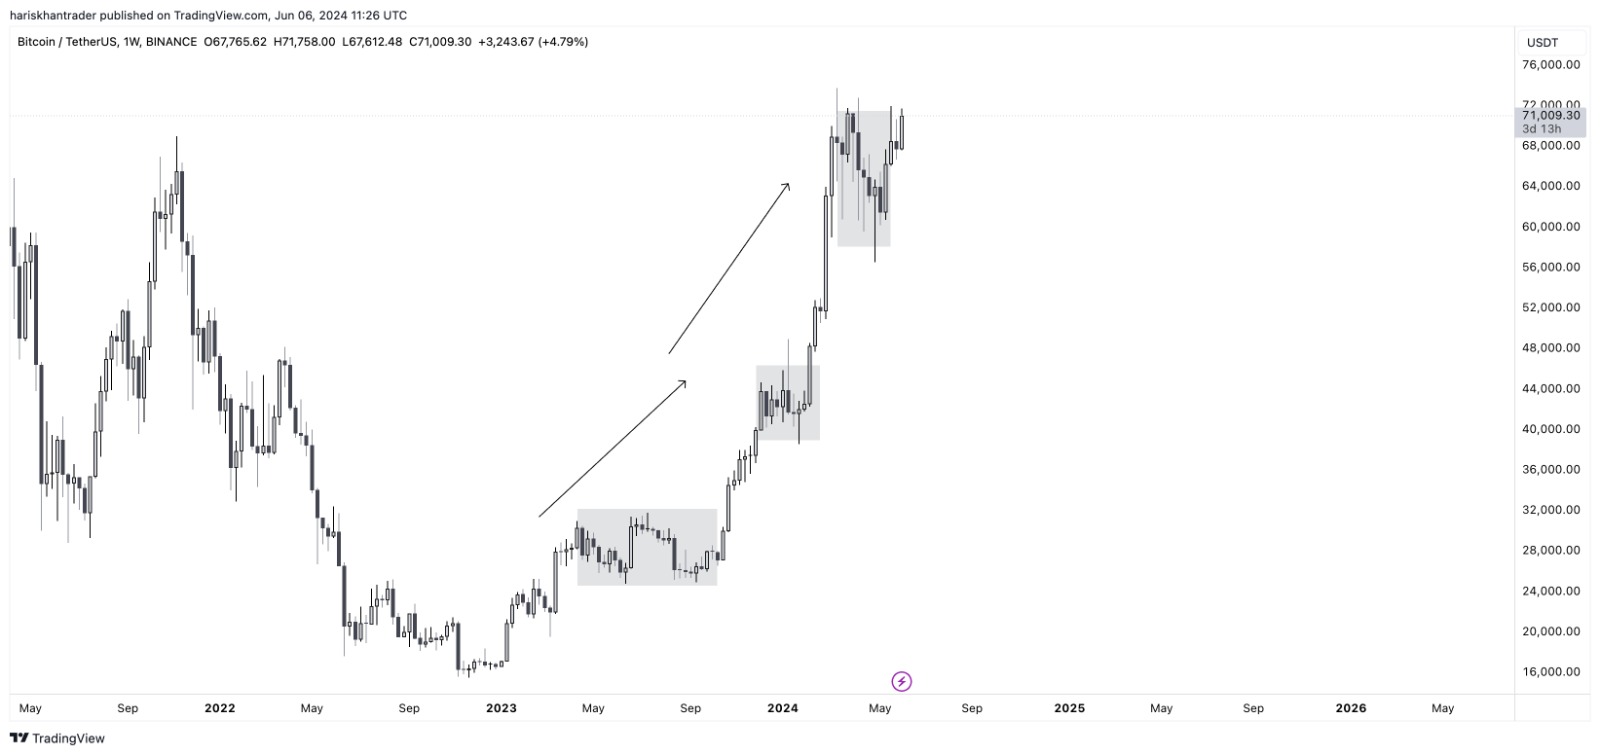
Above, you can see other historical scenarios of expansion and contraction. When it bursts, it explodes. The pattern closely resembles the bullish flag pattern; the breakout begins after the formation of the flag. The pattern held through in previous similar scenarios.
Bitcoin Monthly Chart: Bitcoin reclaims range high liquidity
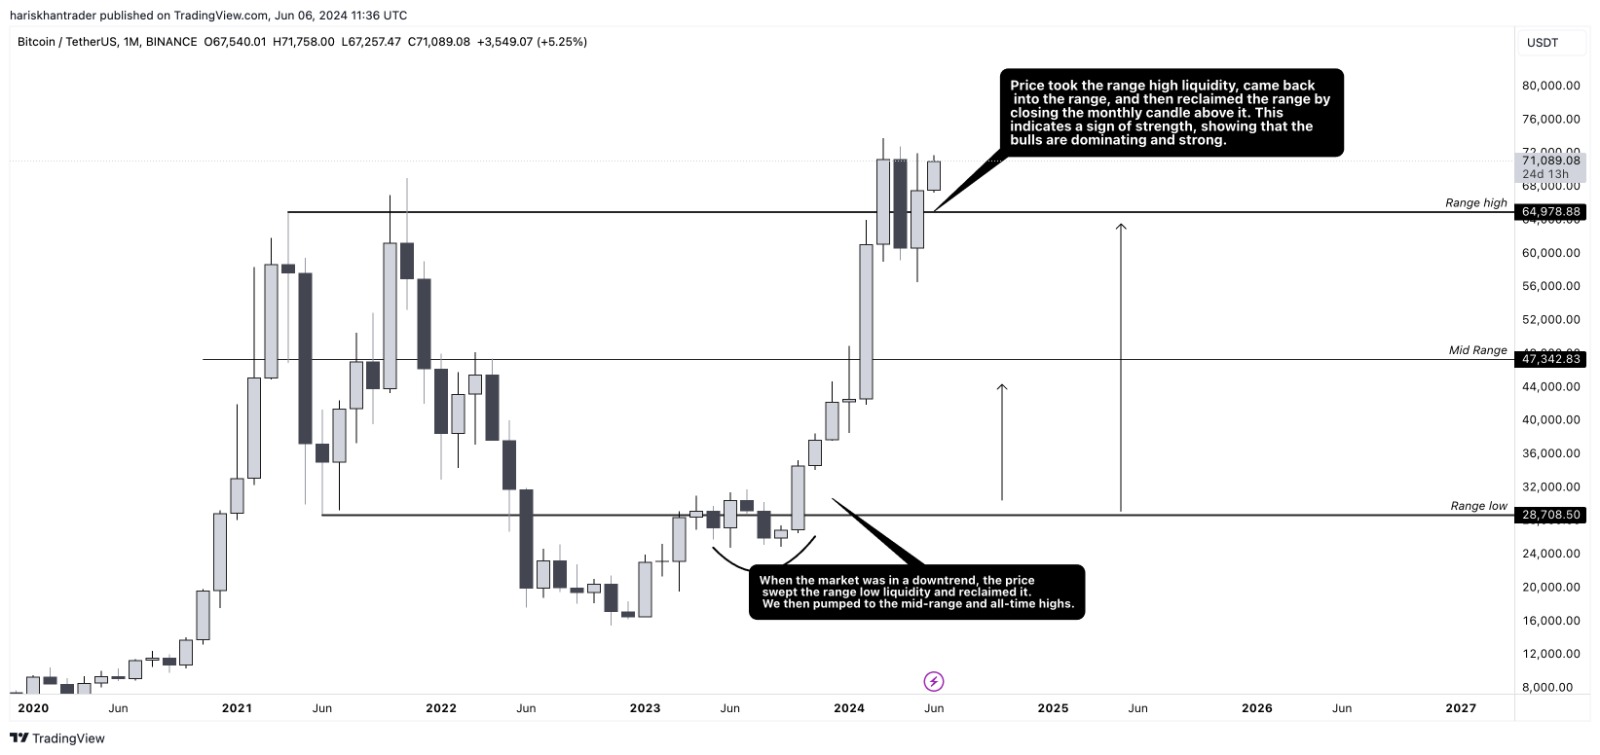
Lastly, on the monthly chart, Bitcoin swept the liquidity at the range low in the second half of 2023, indicating a shift in market structure. This month, the price took the range-high liquidity, returned to the range, and reclaimed it by closing above the monthly candle. This particular movement is a show of strength, particularly for the bulls. However, it is also plausible that Bitcoin will retrace to the $63k level and remain bullish.
Note that if the daily candle closes below $56.5k, it will invalidate the current formation, which is critical for a complete trend shift. Diving into shorter timeframes can get technical and, therefore, suitable for traders.
Based on the current formations, we can conclude that a $90 to $100k is highly possible should the current trend hold. However, remember, the crypto market is highly volatile. The price can drop in a moment’s notice, driven by changing market fundamentals.


