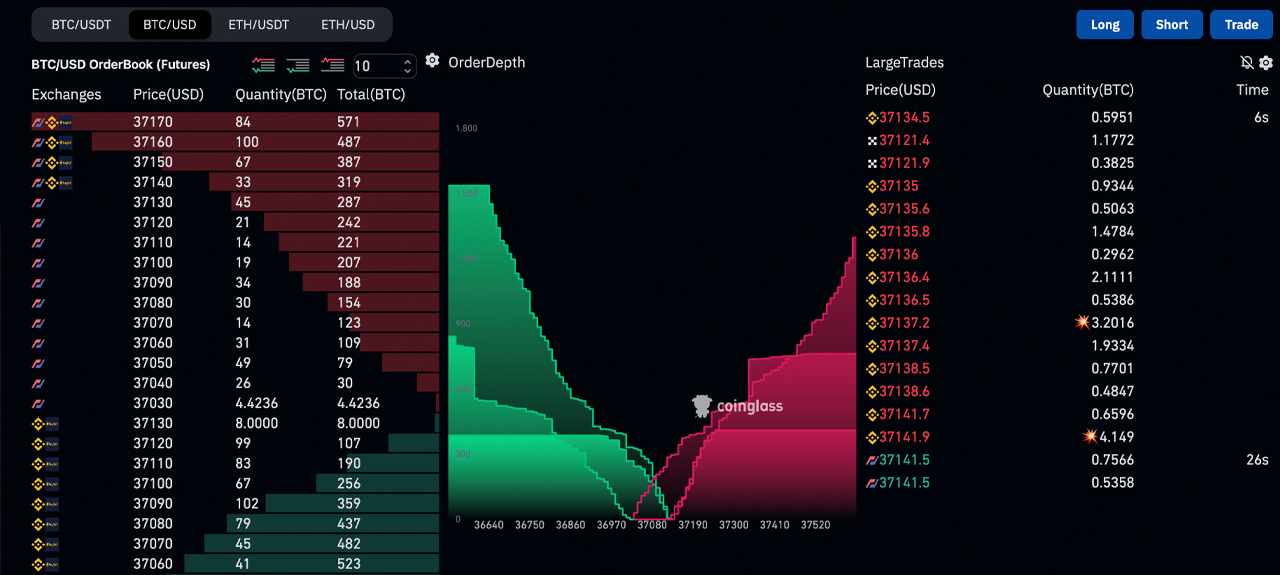
On Sunday morning Eastern Time (ET), bitcoin’s trading value hovers slightly over the $37,000 mark per unit, peaking at $37,294 for the day. There’s a slight dip in BTC trading volume over the weekend compared to the previous weekday, totaling $10.76 billion of the crypto economy’s $67.15 billion. Over the last day, bitcoin has seen a modest decline of 0.4%, but it’s up by 5.5% over the past week and has surged just above 38% in the last month.
Bitcoin
Bitcoin’s price oscillations on Sunday show a nuanced battleground between bullish sentiment and potential overbought warnings. The leading cryptocurrency displayed a 24-hour price range between $36,821 and $37,294, with oscillators like the relative strength index (RSI) and the commodity channel index (CCI) signaling caution. Meanwhile, moving averages suggest a continued uptrend, presenting a complex scenario for traders.
On the oscillator front, bitcoin’s RSI reached a high level of 80, typically indicating overbought conditions that could precede a price pullback. The Stochastic oscillator echoed this sentiment with a value also at 80, but held a neutral stance, suggesting hesitation among traders about immediate price direction. The CCI’s reading at 155 further supports the overbought signals, urging investors to brace for potential volatility or a short-term correction in price.
Moving averages tell a different story, revealing a continued and strong bullish trend across multiple time frames. Short-term support is evident with the 10-day exponential moving average (EMA) and simple moving average (SMA) sitting at $36,086 and $35,917 respectively, both indicating an optimistic sentiment in the market. The longer-term outlook remains bright as well, with the 200-day EMA and SMA at $28,672 and $28,696, asserting a strong foundation for growth.
The interplay between the shorter-term and longer-term moving averages, along with the EMA and SMA data, showcases a sustained growth trajectory for bitcoin. The consistent optimistic sentiment signals across the 20, 30, 50, 100, and 200-day intervals underscores the momentum that has been building. This suggests that despite the short-term overbought signals from oscillators, the undercurrent of bitcoin’s market sentiment leans toward a bullish continuation. The Crypto Fear and Greed Index (CFGI) hosted on alternative.me, shows a position of “greed” on Sunday with a score of 73.
Concurrently, U.S. stock markets wrapped up Friday on a positive note, with key benchmark indices recording rises from 1-2%. Come Monday, the financial world sets its sights on the monthly U.S. federal budget statement. Following this, Tuesday’s agenda is marked by the U.S. Labor Department’s unveiling of the consumer price index (CPI). The week will further unfold with updates on housing sales and unemployment claims. These elements, combined with the broader economic climate and global tensions, may sway bitcoin’s valuation throughout the week.
Register your email here to get weekly price analysis updates sent to your inbox:
What do you think about bitcoin’s recent market action? Share your thoughts and opinions about this subject in the comments section below.


