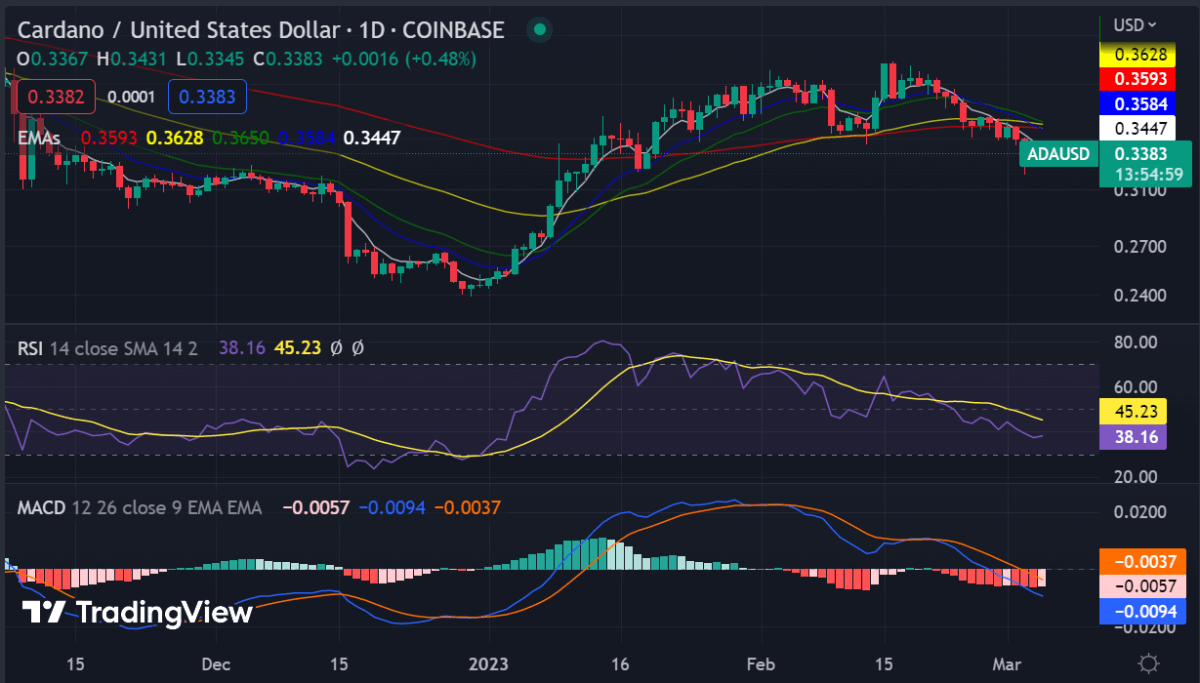
Cardano price analysis shows a bearish trend as ADA/USD has declined by 1.00% in the past 24 hours and is currently trading at $0.3383 on market exchanges. The selling pressure is increasing with prices unable to break above the key resistance at $0.3425. The ADA/USD pair remains in a bearish mode and the next level of support is seen at around $0.3317. If prices break above this level, then the bulls may gain some momentum in taking control of the market.
The 24-trading volume of Cardano is recorded at $186,179,005 and the market capitalization stands at $11,737,371,627. The volume has decreased slightly by 14.37% and the overall market capitalization has lost more than 0.99%.
Cardano price analysis 1-day price chart: ADA struggles to break above the key resistance
The one-day Cardano price analysis is dictating a slight decrease in Cardano’s price after the market faces a bearish upset at $0.3425 and the price decreased to $0.3383. The small red candlestick is indicating a minor loss in the value as the trend lines suddenly move downwards.
The moving average convergence/divergence (MACD) shows a decrease in the MACD line and an increase in the signal line. The relative strength index (RSI) is located at 38.16 and suggests a bearish market for the ADA/USD pair in the near term.

The ADA price has crossed over the 200 EMA with a strong momentum but the making of a bearish candle is suggesting that the market might soon take a correction while rejecting the support from recent levels also the 20 EMA is moving towards the 200 EMA but if the price does not sustain above it 20 EMA might follow the price action by taking rejection from the 200 EMA.
Cardano price analysis: Recent developments and further technical indications
The hourly Cardano price analysis is suggesting that the bearish momentum is increasing as there are consecutive red candlesticks, indicating a decrease in value. The bulls need to take control at this moment or else the bearish pressure will continue leading to more losses. The buyers are struggling to break above the key resistance at $0.3425 and if this level is breached then a new uptrend will be initiated in the market. The RSI curve is below the level of 39.30, suggesting a bearish market for ADA/USD in the near term.

The moving average convergence/divergence (MACD) shows a negative market with the signal line and MACD line both decreasing. The histogram is in red and is indicating a continuous decrease in the ADA/USD pair. The EMA’s are suggesting a bearish trend as the 20 EMA is located below the 200 EMA and is moving towards it. The exponential moving average also suggests that the major trend is bearish as selling is taking over the market.
Cardano price analysis conclusion
To sum up, Cardano price analysis shows that ADA/USD is struggling to break above the key resistance at $0.3425 and bears remain in control of the market with prices trading below this level. The selling pressure has increased and the market is dictating a bearish trend in the near term. The buyers need to take control of the market at this time or else the price will continue to decrease. With all these technical indicators, we can conclude that ADA/USD is currently in a bearish zone and further losses are expected if prices remain below the key resistance.


