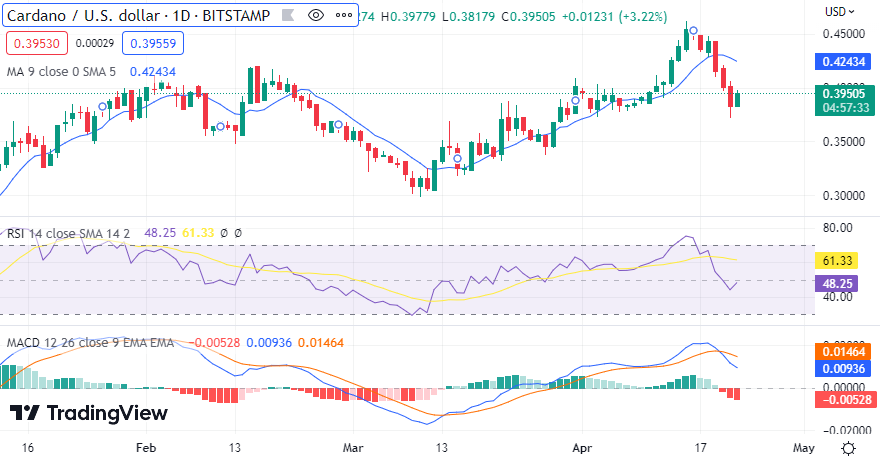
The Cardano price analysis is bullish today as the coin found support after swinging low below $0.3800 yesterday. Bullish momentum is quite steady today as the price has been continuously rising during today’s trading session. As the price continues to rise, selling pressure has not yet been built, and the price has touched $0.3959 currently.
The next resistance for ADA is present at $0.3985, so we can assume the selling pressure will be high above the current price level. The support for ADA is present at the $0.3804 level. This may act as a cushion for the price in case of any bearish pressure. The market capitalization of Cardano is currently around $13.7 billion and the 24-hour trading volume is seen at $313 million.
Cardano price analysis 1-day chart: Bulls in ADA make a recovery toward the $0.4000 level
The daily chart for ADA shows a recovery from the losses suffered from the past week in the crypto market had been overwhelmed by selling pressure. The recovery today has been steady, and the price of Cardano is seen trading above $0.3900. The current resistance level is near $0.3985, and if it breaks above this level then we can expect bullish momentum to further build up ADA.

The Relative Strength Index (RSI) shows a bullish trend as the indicator has changed its direction and it is currently trading to the north at the 48.25 level. The MACD indicator value is above 0 as the price of ADA is back in a bullish phase. The 200-day moving average (MA) has crossed above its 50-day MA and both are trending up with green candlesticks forming in the chart indicating a bullish comeback for ADA.
Cardano price analysis 4-hour chart: Recent developments and further indications
The price is going high once again, according to the hourly Cardano price analysis, as an increasing trend has been seen dominating the market in the last four hours as well. Currently, the price is standing at the $0.3959 level. The price recovery speed is satisfactory, but bulls need to show more momentum to challenge the next resistance.

Technical indicators in this timeframe are also in favor of the bulls, as the MACD indicator is still showing positive signs with a bullish crossover above the signal line and green bars forming in the histogram. The RSI has also moved up from the oversold region and is currently trading at 39.92, making it look like ADA will stay above $0.3900 for now. The moving average with a value of 0.3909 is also increasing and the green candlesticks ruling the chart indicate further upside in the coming hours.
Cardano price analysis conclusion
The overall Cardano price analysis shows that ADA has made a good recovery from its losses and the further upside looks promising. The bulls will have to continue this momentum and break above the resistance of $0.3985 to gain more confidence for ADA buyers. If the price breaks above this level, then a further rise toward the $0.4000 level is expected in the near term.


