Cardano’s price analysis shows a strong bearish move today, as the coin just beached the $0.3372 support at the moment. The price has been under pressure since the start of the day, as sellers have been pushing it down. Currently, Cardano is trading near $0.3429 and is in a bearish trend. The bears have been trying hard to break the support level at $0.3372 and below. However, bulls also took the opportunity to buy when the price dropped to $0.3429, pushing it back up to around $0.3511 on the previous day. The bearish momentum is overwhelming as buyers are backing off, contributing to the decline in prices.
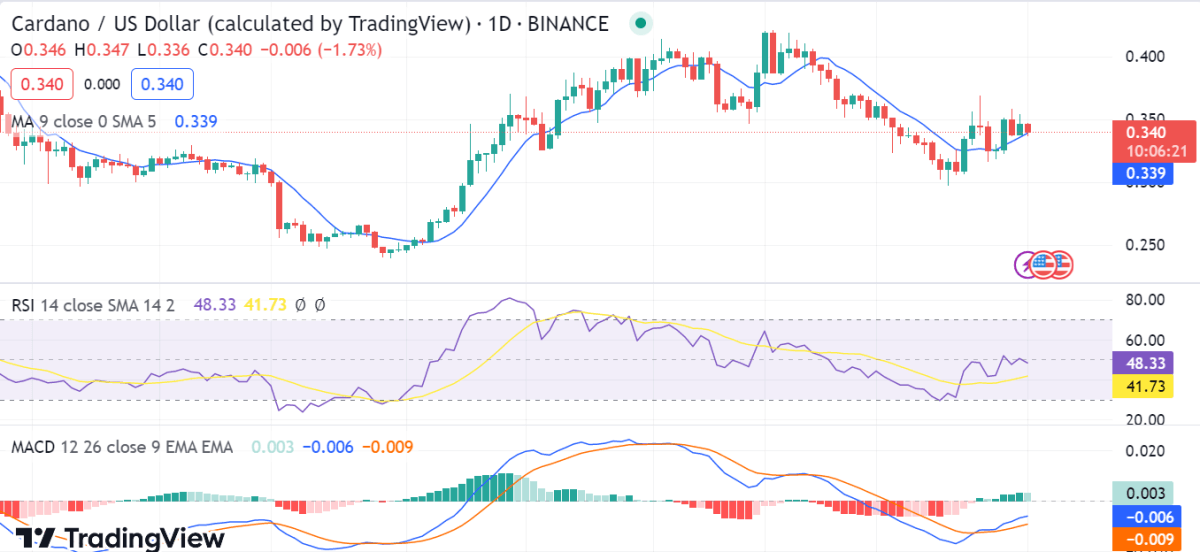
Cardano price analysis 1-day chart: Bears regain control as the ADA price declines to $0.3429
The 1-day Cardano price analysis indicates that the coin is likely to continue its downward trend in the near future. The support level of $0.3372 is expected to be tested if the bearish momentum continues. On the downside, the next significant support lies at $0.3372, followed by $0.3370 and $0.3369, respectively. On the upside, if buyers push the price up, it could test the resistance levels of $0.3527 and $0.3528. If these levels are breached, Cardano could experience a bullish move toward $0.35 and above.

The Relative Strength Index (RSI) for Cardano is currently at 41.73, which signals that the coin is still in a bearish zone and could eventually break down if sellers keep pushing it lower. The moving average convergence and divergence (MACD) and the relative strength index (RSI) are both bearish at the moment, which reflects the downward movement of Cardano. In addition, the 50-day moving average (MA) is close to the current market price, which could act as a strong support level if buyers decide to step in.
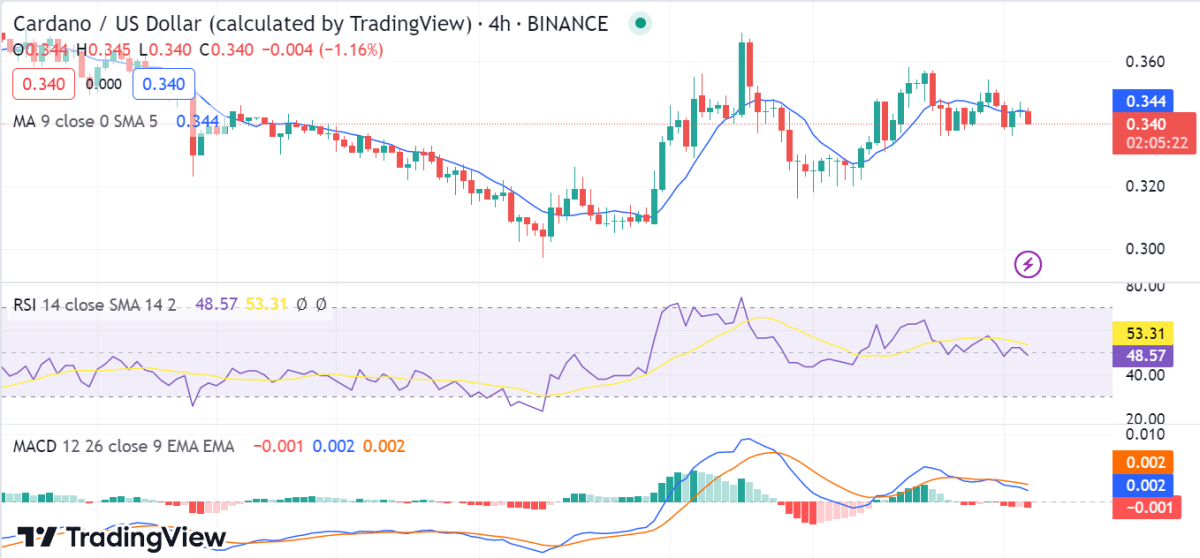
ADA/USD 4-hour price chart: Cardano consolidates at $0.3429 as it corrects slowly
The 4-hour Cardano price analysis also points to a bearish outlook. The price level will continue to drop as long as the bears maintain their dominance. Cardano’s value is fluctuating around $0.3429 after going through some declines in recent hours. The ADA value has somewhat declined over the last couple of hours; at the time of writing, it is $0.3429 and is now appearing to be declining. The ADA/USD pair has lost around 0.52 percent since the start of the current session, and the weekly value estimation has lost 1.75 percent as well.

Looking at the technical indicators, the MACD shows a bearish cross, indicating that the price may continue to fall in the near term. The Relative Strength Index (RSI) is currently at 53.31, which indicates that buyers are losing their grip on the market and bearish forces are dominating. The moving average indicator (MA) shows that the 50-period MA is still well below the 200-period MA, indicating bearish momentum in the market.
Cardano price analysis conclusion
In conclusion, Cardano’s price analysis suggests that the coin is likely to continue its downward trend in the near future. The support levels of $0.3372 and $0.3370 are expected to be tested if the bearish momentum continues. On the upside, if buyers manage to push the price up, it could test resistance levels of $0.3527 and $0.3528. The overall sentiment is bearish, and traders should remain cautious when entering the market.


