Cardano price analysis is going bearish for the day, as the bears have succeeded in creating a way to strike back after a slight bullish price action. The Bearish momentum has been considerable enough to lower the price levels to the value of $0.3358.
The past few hours have been exceedingly successful for the bears, as the downtrend is huge and cast negative results on the overall value of cryptocurrency. Yet, the most recent progress is going in favor of the bears, as observed from the price charts. The next support for ADA/USD price function is present at $0.3338, where traders can hope for the price to bounce upwards if the support persists.
ADA/USD 1-day price chart: Cardano price face resistance at $0.3552
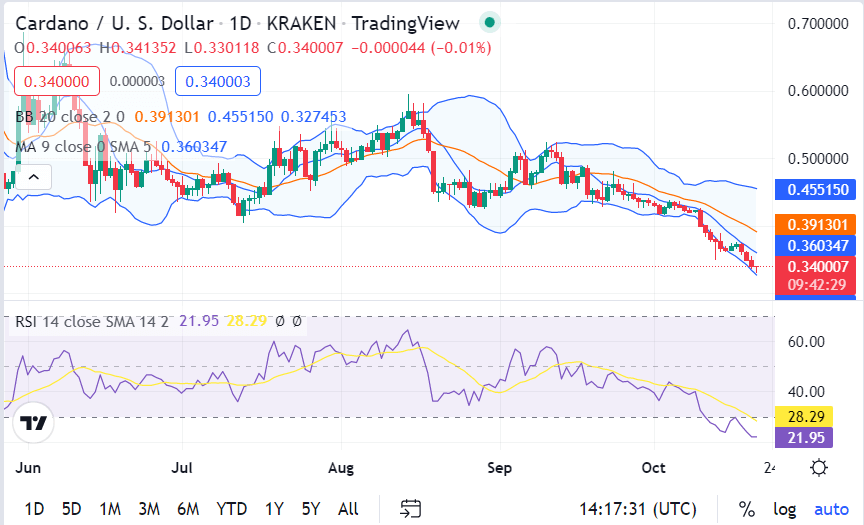
The daily Cardano price analysis predicts a downward trend for the market, as strong selling pressure was observed during the day. The price curve shows a downward slope due to the ongoing bearish wave. Red candlesticks are marking bearish supremacy, and the price moved down to a $0.3358 low in the past 24-hours. Although the bulls controlled the market earlier, the current trend is relatively bearish. The price is still higher than the moving average (MA) value, i.e., $0.360.

The short-term trending line is expected to move descendingly if the current trend resumes in the future. The upper extreme of the Bollinger Bands Indicator is standing at $0.3603 point, whereas the lower extreme is standing at $0.3400 edge. The Relative Strength Index (RSI) score has dropped up to 28.29 due to the latest downturn in price.
Cardano price analysis: Bearish wave continues as price further downgrades to $0.3358
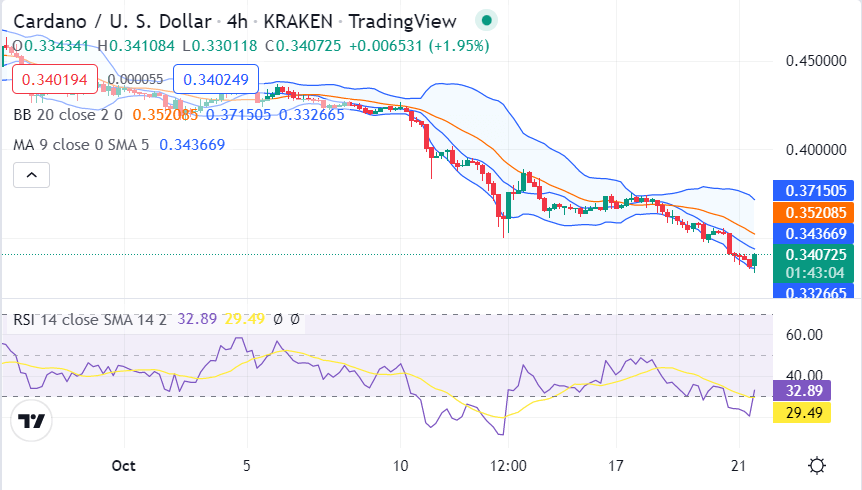
Cardano price analysis shows that the bears are again occupying the leading position on the hourly price chart, as the price followed a downward movement in the past four hours. Although there have been constant variations in the price trends over the past few hours, the bears are currently winning the game. The coin value has been devalued to $0.3358 as the bears have made a successful comeback. However, the moving average value is at a much greater height, i.e., $11.178.

A cross-over between the SMA 50 curve and the SMA 20 curve is also taking place, which further confirms the downtrend. The upper band of the Bollinger bands indicator is occupying the $0.3520 position, whereas its lower band is sitting at the $0.3326 position. Lastly, The RSI curve moves in the bearish direction as the score has dropped to 29.49.
Cardano price analysis conclusion
The 1-day and 4-hours Cardano price analyses confirm that the most recent trend has been bearish, which has resulted in a decrease in price. The price has lowered up to $0.3358, which is a very low value compared to its position in the last trading session. Yet, the support level at $0.3338 seems strong, and there is little possibility that the price will go lower than the support.
Disclaimer. The information provided is not trading advice. Cryptopolitan.com holds no liability for any investments made based on the information provided on this page. We strongly recommend independent research and/or consultation with a qualified professional before making any investment decisions.


