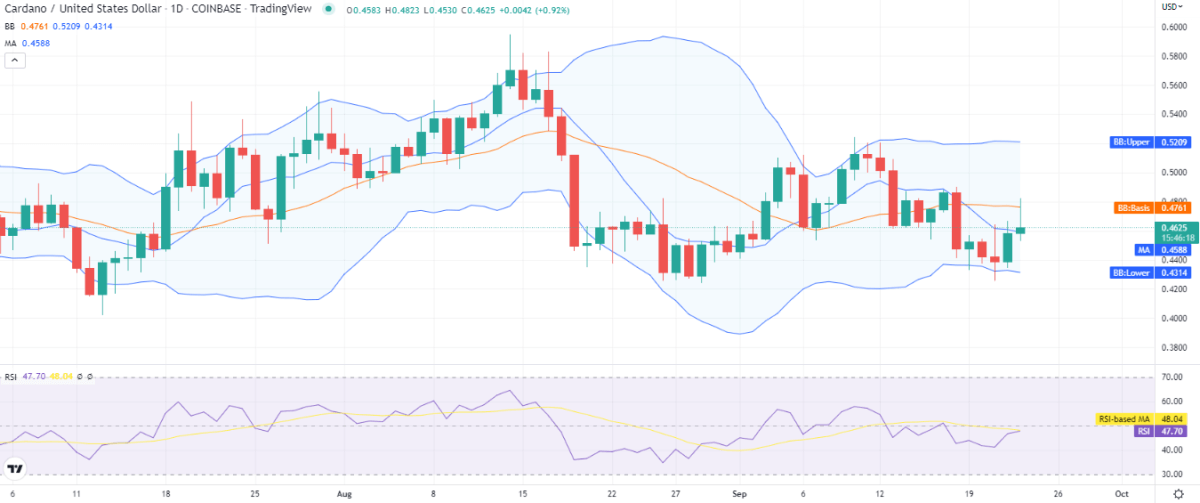
The current Cardano price analysis is bullish for today as the ADA/USD price level has reached the mark of $0.462 again as the coin found support and rejected further downside below $0.437. The bullish momentum has been restored after some strong corrections that took place during the past week, with a momentary swing as low as the $0.425 level. ADA successfully crossed the resistance of $0.452 yesterday and is moving ahead. Selling pressure is expected at this level before ADA aims for the next resistance of $0.480, as ADA has observed a strong rejection at $0.477 just recently.
ADA/USD 1-day price chart: ADA gains 2.42 percent
The one-day chart for Cardano price analysis shows that the bullish momentum is strong, and a further price increase is expected in the coming hours as bulls continue their rally. However, some selling pressure is also expected at the current price level of $0.462 as it is a resistance zone set by bears on 26 August 2022 when a flash crash was observed. ADA/USD also reports an increase in price value by 2.42 percent during the last 24 hours, but the trading volume has decreased by 5.30 percent for the same time period.

The volatility is mild as the Bollinger bands are maintaining their values, with the upper band at the $0.520 mark and the lower band at the $0.431 mark. The average of the indicator is forming at $0.476. The moving average (MA) is at the $0.458 mark below the price level. The relative strength index (RSI) is trading on an upwards curve at index 47, hinting at the buying activity in the market.
Cardano price analysis: Recent developments and further technical indications
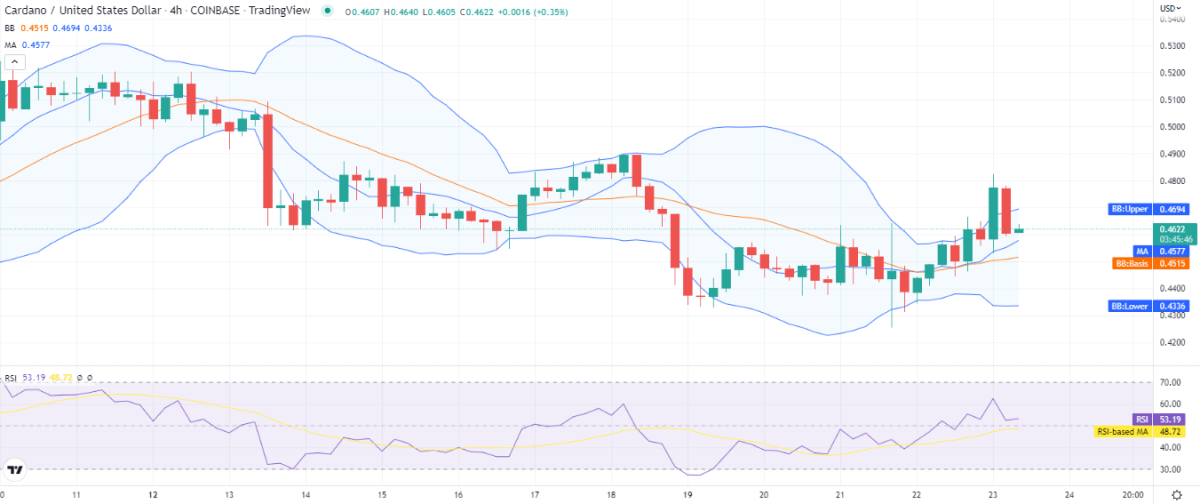
The 4-hour Cardano price analysis shows the coin price function is facing the resistance present at $0.477 currently as bears showed an immediate reaction after a swing high observed at the start of the trading session. The bears brought a strong correction. However, the price is increasing again, which is a hopeful sign, but at the same time, it seems like the bearish pressure is also building up, and bears will not let a price spike easily.

The volatility is increasing on the 4-hour chart. The upper end of Bollinger bands is at the $0.469 mark representing resistance now, as the price has corrected below the upper band after a spike high above, and the lower band is at $0.436, representing the strongest support. The average of Bollinger bands is being formed at $0.451 below the price level, and the moving average (MA) is at the $0.457 mark. The relative strength index (RSI) is moving in the upper half of the neutral zone with much more room for further bullish practice as the indicator trades at index 53.
Cardano price analysis conclusion
The one-day and four hours Cardano price analysis shows bullish price action mostly up till now, but bearish shadows are also there. Bulls are currently in the lead at $0.462 as they are making an effort to enhance the price further. However, as the bearish pressure is still there, the trend can turn negative at any time. On the other hand, if bulls show consistency, then the price can increase a little further as well.
Disclaimer. The information provided is not trading advice. Cryptopolitan.com holds no liability for any investments made based on the information provided on this page. We strongly recommend independent research and/or consultation with a qualified professional before making any investment decisions.


