The Cardano price analysis is back in the green zone as bullish momentum builds in the market. At the time of writing, Cardano’s ADA coin is trading at $0.3806 with more buying pressure pushing the price up. The ADA/USD pair is facing rejection at the $0.3866 level and has fallen back slightly to $0.3806. gaining more than 6.26% on a 24-hour scale. The downtrend was in the market since the beginning of the trading session yesterday, but it seems that the bulls have finally taken charge and pushed the price up above the $0.3806 level.
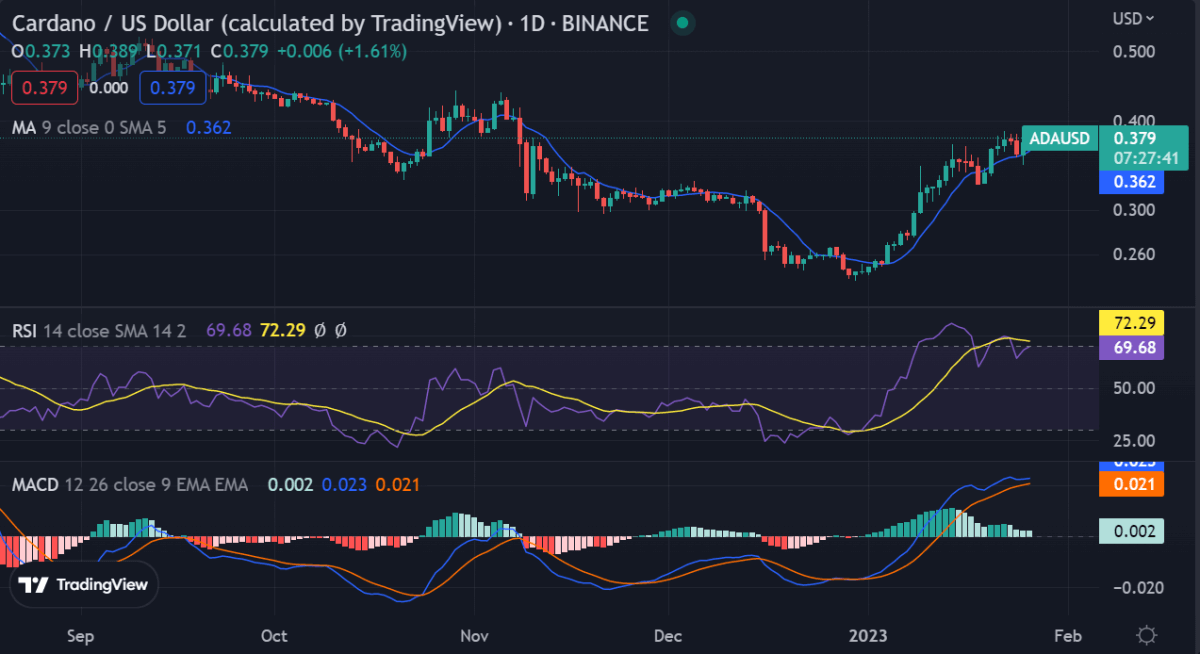
ADA/USD 1-day price chart: Price on the rise as bulls have taken the reigns again
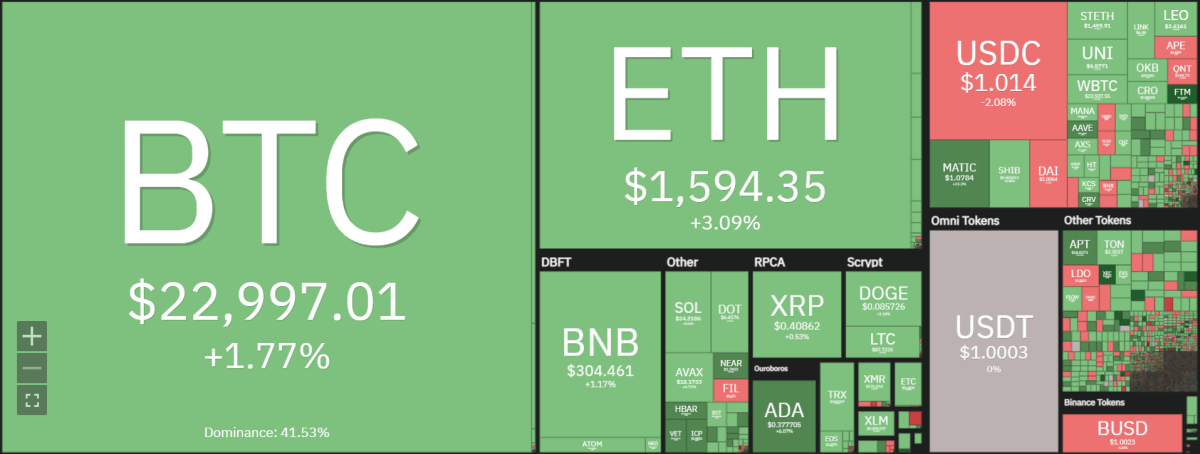
The daily chart for Cardano price analysis shows that the buying pressure is still present in the market and its support levels have held firm at $0.3537. ADA/USD pair the coin is trading in a range of $0.537- $0.3866, with the bulls trying to break this resistance level and take it higher for further gains. Looking at the market cap, Cardano is ranked in the 8th place and has a market cap of $13.02 billion at the time of writing, With more buyers in the market. The 24-trading volume has been steadily increasing, which could be a sign that the bulls are in charge of the market and buyers are taking advantage of this positive trend.

Looking at technical indicators, Cardano’s MACD is in the positive zone and its RSI remains above 50, indicating that buyers are still in control of the market. The current price level is above both its 20-day simple moving average (SMA) and 50-days SMA, indicating a bullish trend is still prevalent. The moving average indicator is also in the positive zone, confirming that more buyers are buying into ADA/USD.
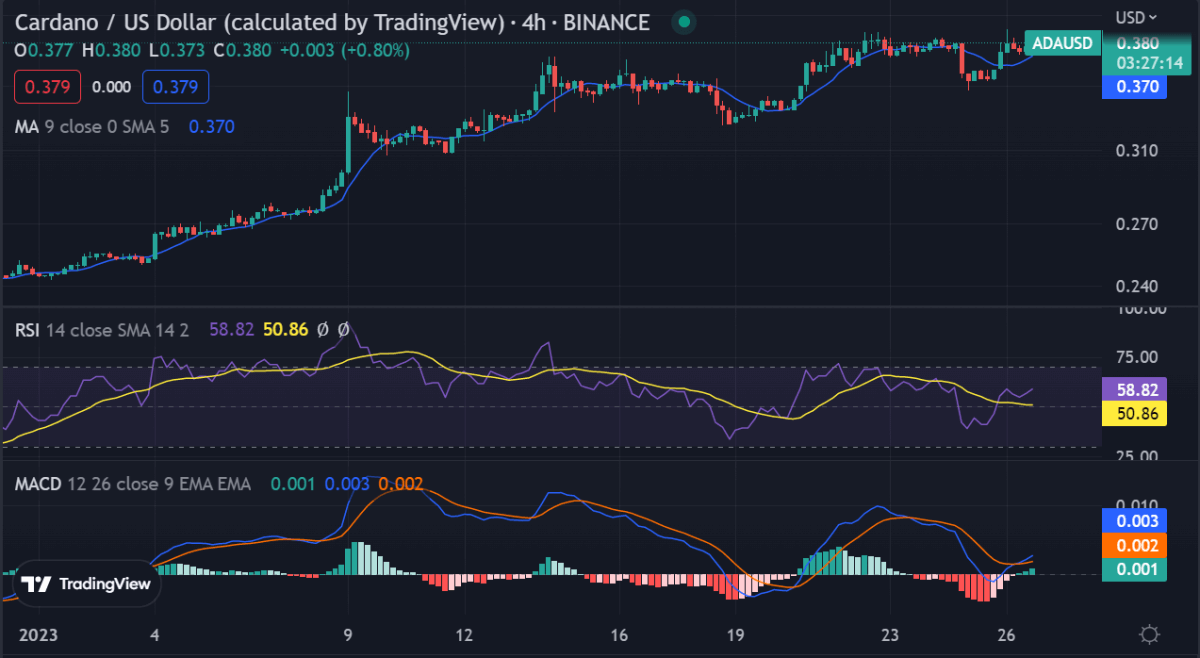
Cardano price analysis 4-hour price chart: Uptend forms ascending triangle pattern
Looking at the 4-hour price chart, Cardano price analysis is forming an ascending triangle pattern, a bullish continuation formation that indicates that bulls are still in control of the market. The uptrend seems healthy as the coin is trading above both its 50-day MA and 200-day MA, indicating that the bulls are still in control. The Moving average (MA) is currently at $0.379, indicating that the uptrend is intact and buyers are accumulating ADA coins at lower levels.

The hourly relative strength index (RSI) is slightly above 50 which shows that the coin is overbought and could correct lower before forming a new uptrend. The MACD indicator has also formed a bullish crossover, further confirming the positive resistance levels remain at $0.3866 and beyond the trend in the market, with the histogram widening and the MACD line also crossing above the signal line.
Cardano price analysis conclusion
Overall, Cardano’s price analysis is trading in a healthy uptrend with buyers being in control of the market. The coin has held strong at its support level and is currently looking to break through the resistance levels for further gains. With more trading volume coming in, there’s a good chance that Cardano price analysis will hit new highs soon.


