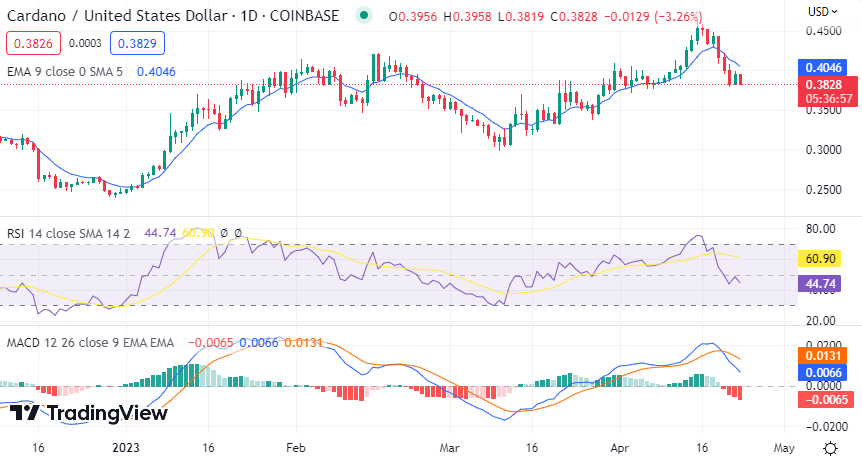
Cardano price analysis shows that ADA/USD is currently trading down more than 2 percent on the day at $0.3843. The pair has been trending lower over the past week and the bearish momentum is likely to persist in the near term. The bears are currently controlling the market and are aiming for a deeper correction if the price fails to stay above the current support level of $0.3839.
At the time of writing, ADA/USD is trading near the support level at $0.3839, which may pose an obstacle to further upside movement. The bulls will have to break this level in order to push the price higher since the bearish trend could be extended if the pair fails to stay above $0.3839.
Cardano price analysis 24-hour price chart: ADA value drops toward the $0.3800 mark
The daily chart for Cardano price analysis displays ADA trading in a downtrend as bears have continued to apply heavy selling pressure and the price has dropped near the $0.3800 mark. The bearish momentum is persisting and the price is currently above the 20-Day EMA ($0.3826).

The technical indicators in this timeframe also support the bearish case as the MACD line has crossed over the signal line. The bars on the histogram are red and progressing in length, indicating that the bearish pressure may continue in the near term. The Relative Strength Index (RSI) indicator is sloping to the south and below the 50 level, which reflects bearish market sentiment.
Cardano price analysis 4-hour price chart: Recent developments
Cardano price analysis on the 4-hour chart reveals that the pair is trading in a bearish channel and is close to testing the support at $0.3839. The bears have been applying heavy selling pressure and if this continues, ADA/USD could break below the stated level.

The Relative Strength Index (RSI) indicator is heading to oversold territory, suggesting that the bears may take a break and allow the price to consolidate. The current value for RSI stands at 32.98. The exponential moving average (EMA) indicator is also showing a bearish outlook as the 20-Day EMA has crossed below the 50-Day EMA. The MACD line is on the verge of crossing into the bearish zone and appears to be gaining strength.
Cardano price analysis conclusion
Overall, Cardano price analysis suggests that the ADA/USD pair could face further downside pressure if it fails to stay above the support level at $0.3839. The technical indicators are also supporting the bearish case and suggest that a deeper correction is possible in the near term. However, traders should keep an eye on the key resistance levels for any signs of bullish momentum.


