Cardano price analysis shows price moving on the up over the past 24 hours, after ADA recorded a 4 percent increment to move up to $0.2517. Over the past month, ADA has remained largely bearish, and the trend is set to continue into the new year despite today’s upturn. Cardano price broke down from the $0.30 resistance on December 16 and has since remained in a horizontal trend. If corrected further, price could test the immediate support zone at $0.150, causing another 35 percent downtrend from the current price level.
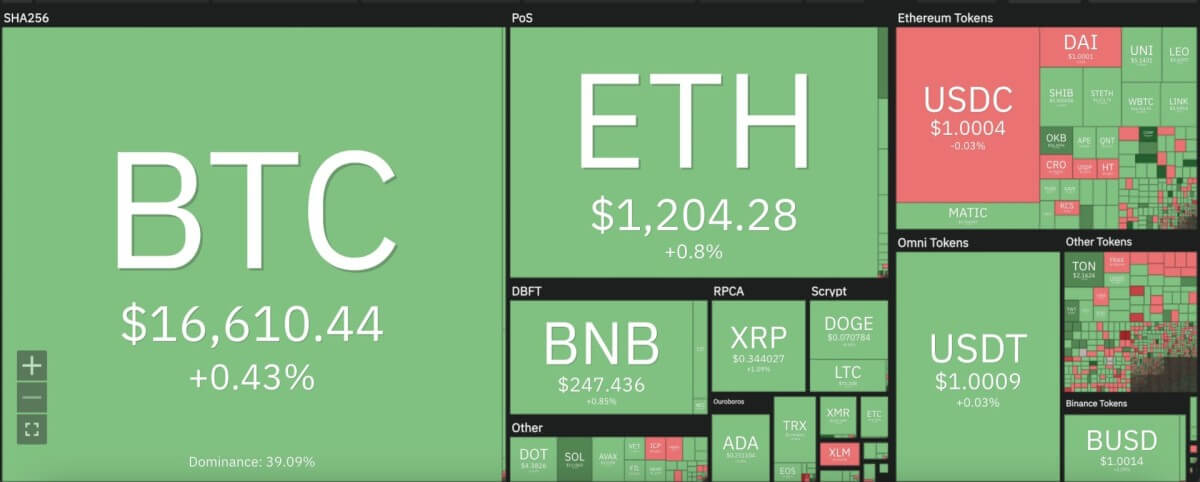
The larger cryptocurrency market recorded minor increments from yesterday’s price across the board, led by Bitcoin’s revival past the $16,500 point. Ethereum rose 1 percent to move above $1,200, while leading Altcoins also recorded similar uptrends. Ripple moved up by 1 percent to move up to $0.34, whereas Dogecoin made a 4 percent rise to move past the $0.07 mark. Meanwhile, Polkadot jumped 2 percent to move as high as $4.38, and Solana rose 6 percent to move past the $10 price point.

Cardano price analysis: RSI on the up but remains in oversold zone on the daily chart
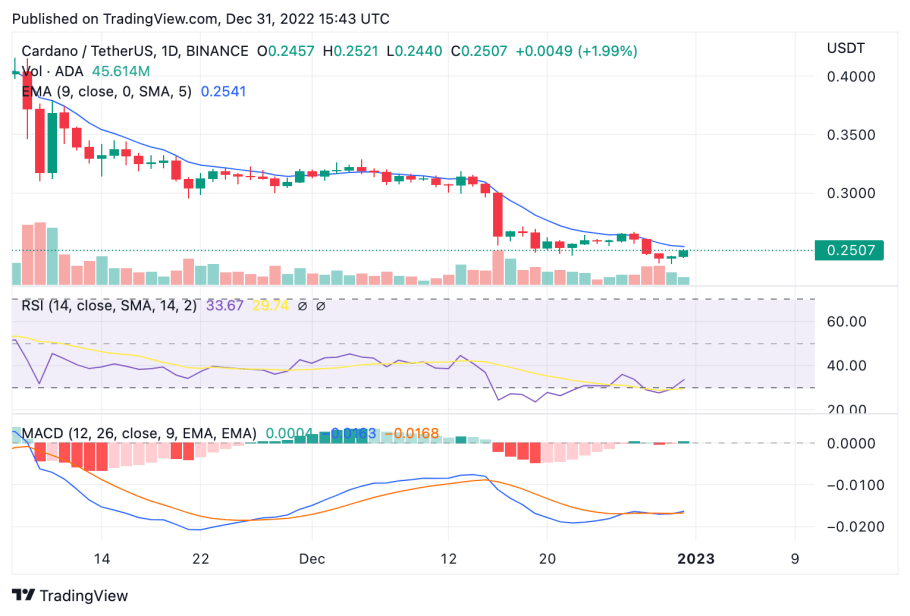
On the 24-hour candlestick chart for Cardano price analysis, price can be seen largely extending sideways since the 16 percent downtrend occurring on December 16. Despite today’s positive movement, ADA remains behind the important 9 and 21-day moving averages, along with the 50-day exponential moving average (EMA) at $0.255. The 3 percent price upswing was coupled with a 28 percent decrease in trading volume, indicative of a changing trend for ADA in the market.

The 24-hour relative strength index (RSI) can be seen moving upwards over the past 24 hours, but remains largely within the oversold region in the early 30’s. If the RSI fails to recover up to the 45 mark, price can be expected to correct further before the next uptrend to move down to the $0.15 support. Moreover, the moving average convergence divergence (MACD) curve shows a further bearish trend for ADA after failing to validate a bullish divergence.
Disclaimer. The information provided is not trading advice. Cryptopolitan.com holds no liability for any investments made based on the information provided on this page. We strongly recommend independent research and/or consultation with a qualified professional before making any investment decisions.


