The latest Cardano price analysis indicates that bulls are continuing to make progress. The buying pressure has pushed ADA up to $0.3790, a 0.22 per cent increase in the last 24 hours. ADA opened today’s trading session at $0.3774 and moved higher to face resistance at $0.3859 before retracing slightly below the $0.3800 level.
The bulls are currently facing resistance at the $0.3859 mark, which is expected to be broken in the near term if buyers can stay strong enough. On the other hand, support stands at $0.3764, which has successfully defended the price from dropping further. If this support fails to hold, ADA could be vulnerable to a correction lower towards $0.3650 and even $0.3500.
Cardano price analysis 1-day chart: Can ADA overcome resistance at the $0.3900 mark?
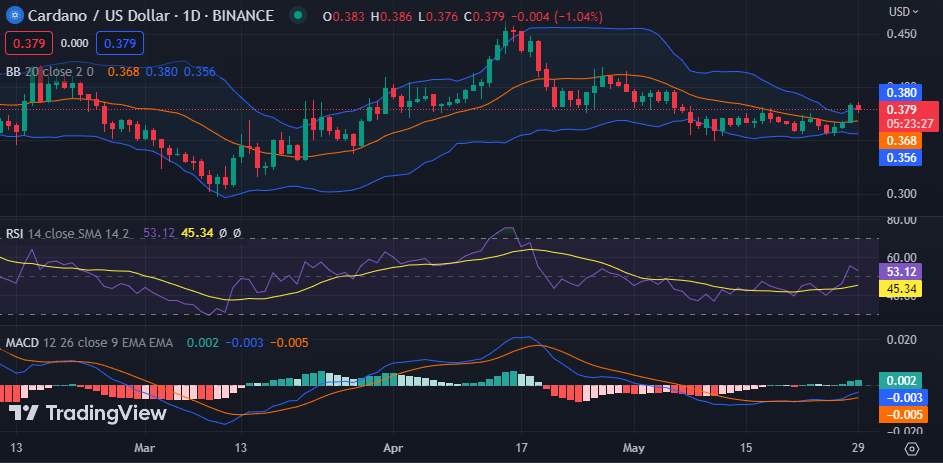
On the daily chart, Cardano price analysis indicates that bulls have pushed ADA above the $0.3800 level and are now facing strong resistance toward the $0.3900 mark. If they can overcome this hurdle, it could open up a path for ADA to reach $0.4000 or even higher in the coming days. The trading volume and market cap have also experienced an increase in the last 24 hours as they stand at $215 million and $13.2 billion, respectively.

On the technical indicators, ADA is showing a bullish trend. The Relative Strength Index (RSI) is currently at 53.12, and the Moving Average Convergence Divergence (MACD) line is above the signal line, indicating that buyers have the upper hand in the market for now. The Bollinger Bands are also showing a widening pattern which may mean an increase in volatility ahead. The upper band is located at $0.3800, and the lower band is at $0.3560, providing strong support for ADA.
Cardano price analysis 4-hour chart: Recent developments and further indications
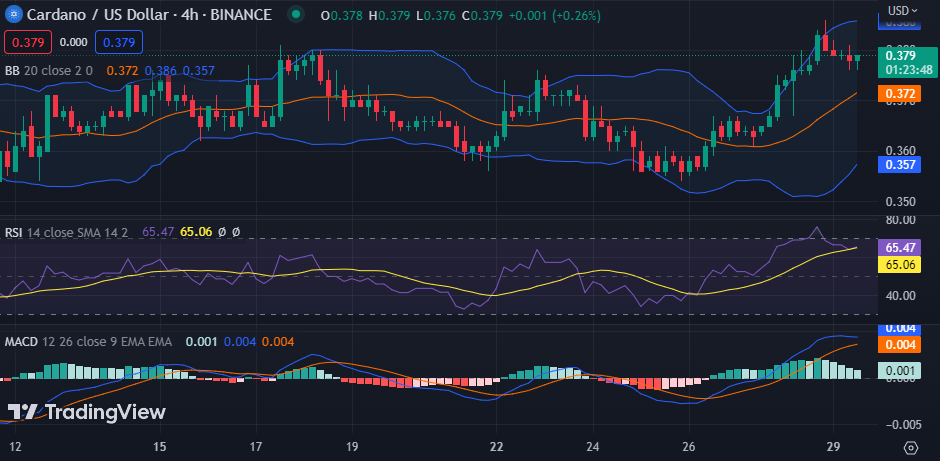
The hourly chart for Cardano price analysis is further bullish as buyers are actively pushing the price upwards. The price has been increasing in the past few hours and is now facing resistance at the $0.3800 mark. The green candlestick is also forming to outdo the red one, indicating that buyers are in control of the market.

The RSI is currently above 65.47, indicating that buyers are in control of the market at the moment. The MACD line is also above the signal line, indicating that a bullish trend is possible in the near term. The green bars on the histogram are further confirmation of a bullish trend in the market. Furthermore, the Bollinger band indicator is showing a widening pattern, indicating that volatility could increase in the coming days.
Cardano price analysis conclusion
In conclusion, Cardano’s price analysis shows that bulls are still in control despite some short-term corrections. The current resistance at $0.3800 and support at $0.3750 should be monitored closely as they may provide clues about ADA’s near-term direction. If buyers can remain in control of the market, ADA could break the current resistance at $0.3859 and target $0.3900 or even higher in the near term.


