Cardano price analysis shows a bullish trend forming, with the price of ADA breaking above the $0.3545 support zone and climbing up to a high of $0.3633 earlier today. ADA kicked off today’s trading session on a low note before steadily rising, reaching the $0.3632 mark.
ADA is now trading around the $0.3632 level and could suffer a few corrections if support fails to hold up at this level. Should sellers manage to bring down the price below the $0.3545 level, it would send ADA into a bearish trend. On the other hand, if buyers manage to sustain the current momentum, we could soon see ADA rising above the $0.3633 resistance level.

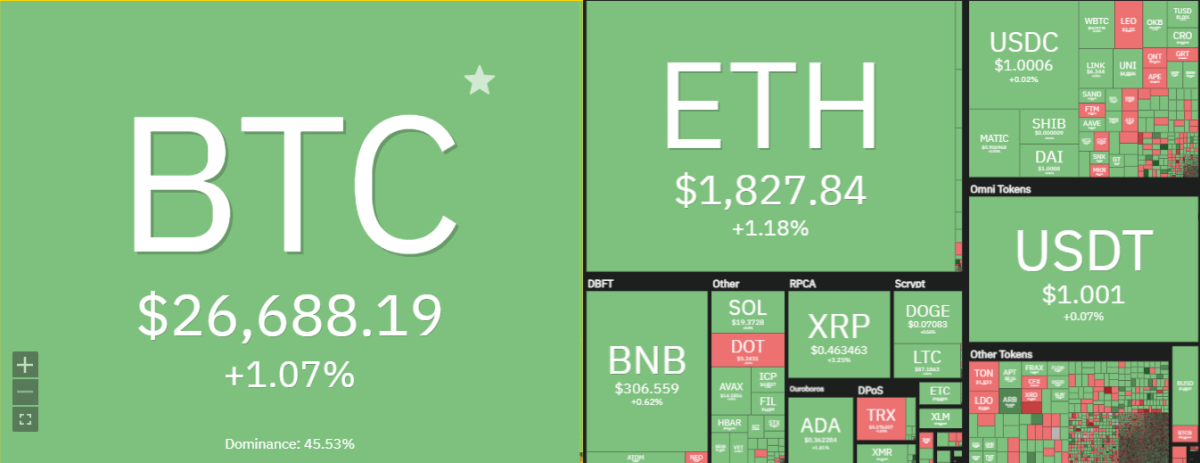
The overall market sentiment for the crypto market is still mostly bullish. Most of the major altcoins, including Cardano (ADA), are currently in a positive outlook as the crypto market recovers from its recent dip. Top coins such as BTC and ETH also trade in the green, indicating a healthy shift in investor sentiment.
Cardano price analysis 24-hour chart: Bulls face resistance at the $0.3620 mark
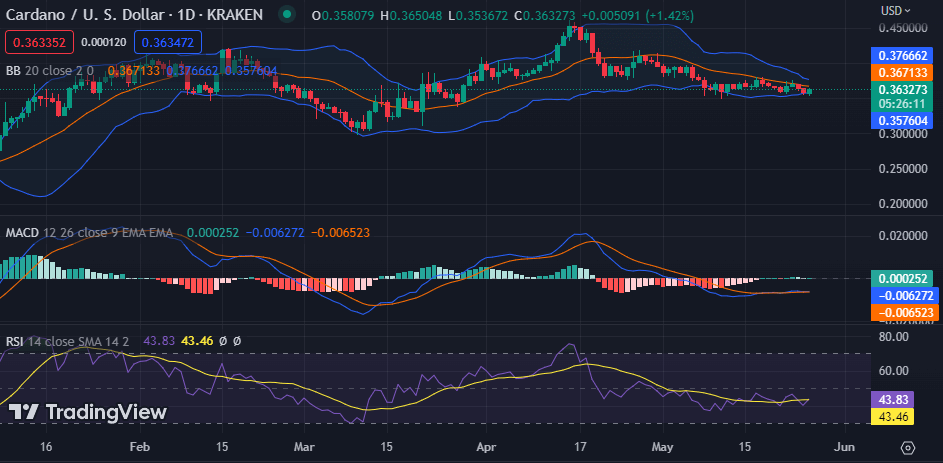
The daily chart for Cardano price analysis shows that the bulls have made some good progress in pushing the price up. The bulls have managed to push the price above the $0.3545 support zone, with strong buying pressure at this level helping ADA to soar up to a high of $0.3633 earlier today.
The trading volume has risen significantly over the past 24 hours, with buyers appearing to be more confident in their positions. The trading volume is $167 million, which is 15.81% higher than yesterday’s.

The technical indicators are in a neutral zone, indicating that if the buying pressure continues, the price could push up to the $0.3633 level and possibly break above it if buyers remain in control. The Relative Strength Index (RSI) stands at 43.83, indicating a neutral zone. The Moving Average Convergence Divergence (MACD) is also in a neutral area, with both its lines currently flat. The Bollinger band width is currently at a low of 0.3671, indicating low market volatility.
Cardano price analysis 4-hour chart: Bulls take the lead
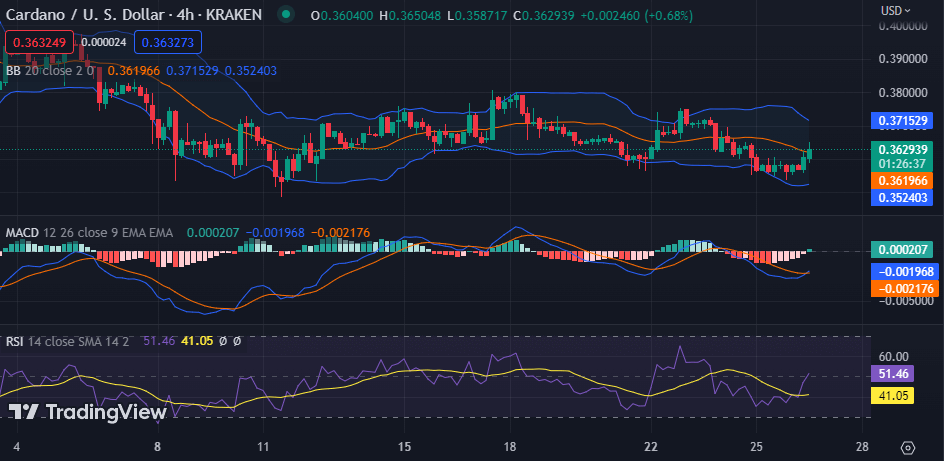
On the 4-hour chart, the bulls have taken control as the price is up above the $0.3545 support zone. The sellers have not been able to force the price below this level as of yet. The price has managed to stay above this level for some time now, indicating that buyers are firmly in control.

The technical indicators are in bullish territory, indicating that the current trend is likely to continue in the short term. The Relative Strength Index (RSI) stands at 51.36, indicating an uptrend. The Moving Average Convergence Divergence (MACD) is also in a bullish area, with its line currently above the signal line. The Bollinger Band indicator shows a wide range of volatility, an indication that the price could move up if the green candle breaks above the upper band.
Cardano price analysis conclusion
Overall, Cardano’s price analysis shows a bullish trend in play. The price of ADA is currently up at $0.3632 and could possibly break above the $0.3633 resistance level if buyers remain resilient. The technical indicators on the 4-hour chart are signalling an uptrend, so the price could climb further if buying pressure remains strong.


