Cardano price analysis is bullish as it shows the price is on the route to recovery today after correcting for a period some hours yesterday. The market was following a bearish trend, but now the situation has changed, and a bullish trend is visible on the charts. Currently, the price is corrected again because, as the price reached $0.3233, the selling pressure built. However, the decrease is negligible, and the price will start recovering again hopefully soon.
The buying pressure is still present, and the bulls are aiming for a new all-time high. The closest resistance to the price is located at $0.3409, and if the price breaks that level, then it can reach higher levels. On the other hand, support for ADA is present at $0.2858, but it is unlikely that the price will reach this level.
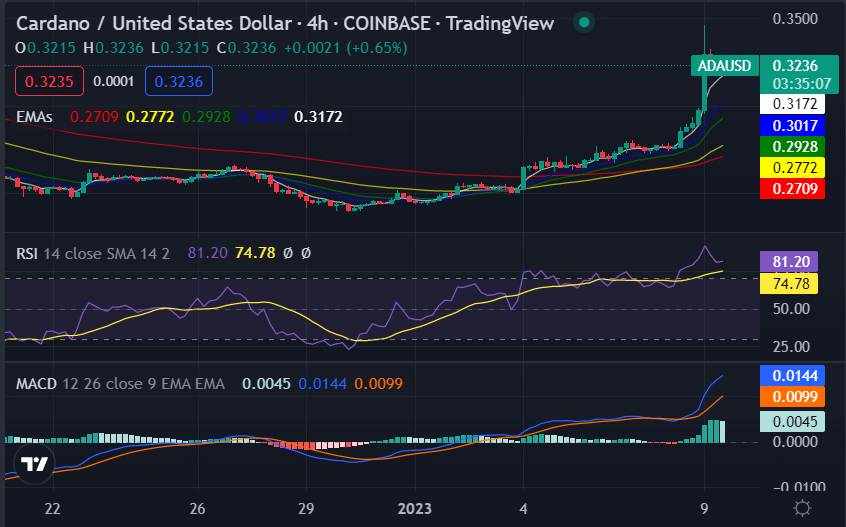
ADA/USD 4-hour chart: Support for Cardano is present at $0.2858
The 4-hour price chart for Cardano price analysis shows the price action is still in bullish momentum. The price breakout was in the upwards direction today, as it came out of the descending triangle pattern. The breakout was a sign that the bulls are still in control and they will take ADA to new highs.

The 20-EMA is still above the 50-EMA, which means that the bullish trend is intact. The MACD is in the green territory and shows that the buying pressure is still present. The Histogram is widening, and the RSI is moving towards the overbought area, which indicates that the trend may continue further.
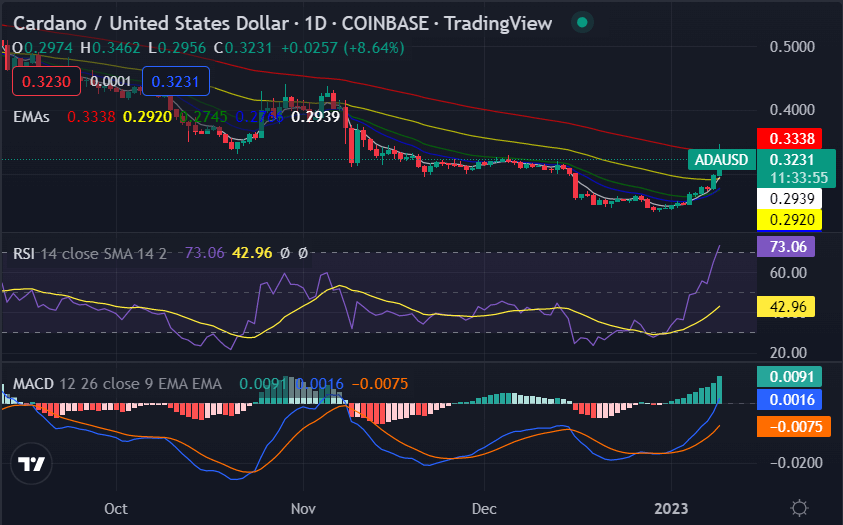
Cardano price analysis 1-day price chart: Market sentiment is positive toward ADA
The 1-day price chart for Cardano price analysis shows that support appeared for ADA at $0.2858, and a huge recovery has been observed in the price levels thereon. The crypto pair is trading hands at $0.3233 at the time of writing, with a gain of 12.71% over the last 24 hours. The 24 trading volume is on the increase at approximately $856 million and is showing a positive market sentiment towards ADA. The market cap of ADA is over $11.14 billion, as of now.

The Exponential Moving Averages (EMA) on the 1-day chart are also in the bullish territory. The 20-EMA is above the 50-EMA and indicates that buying pressure is still present. The MACD line orange line is above the green line and the histogram is widening. The relative strength index (RSI) is on an upwards curve supporting the bullish side at index 42.96 in the lower half of the neutral region, but as the curve is upward, the indicator hints at the buying activity in the market.
Cardano price analysis conclusion
To conclude, the Cardano price analysis shows that the crypto pair is trading in bullish momentum, and the buying pressure will likely take ADA to new highs. The next target for the bulls is $0.3500, buyers are likely to find strong resistance at this level.


