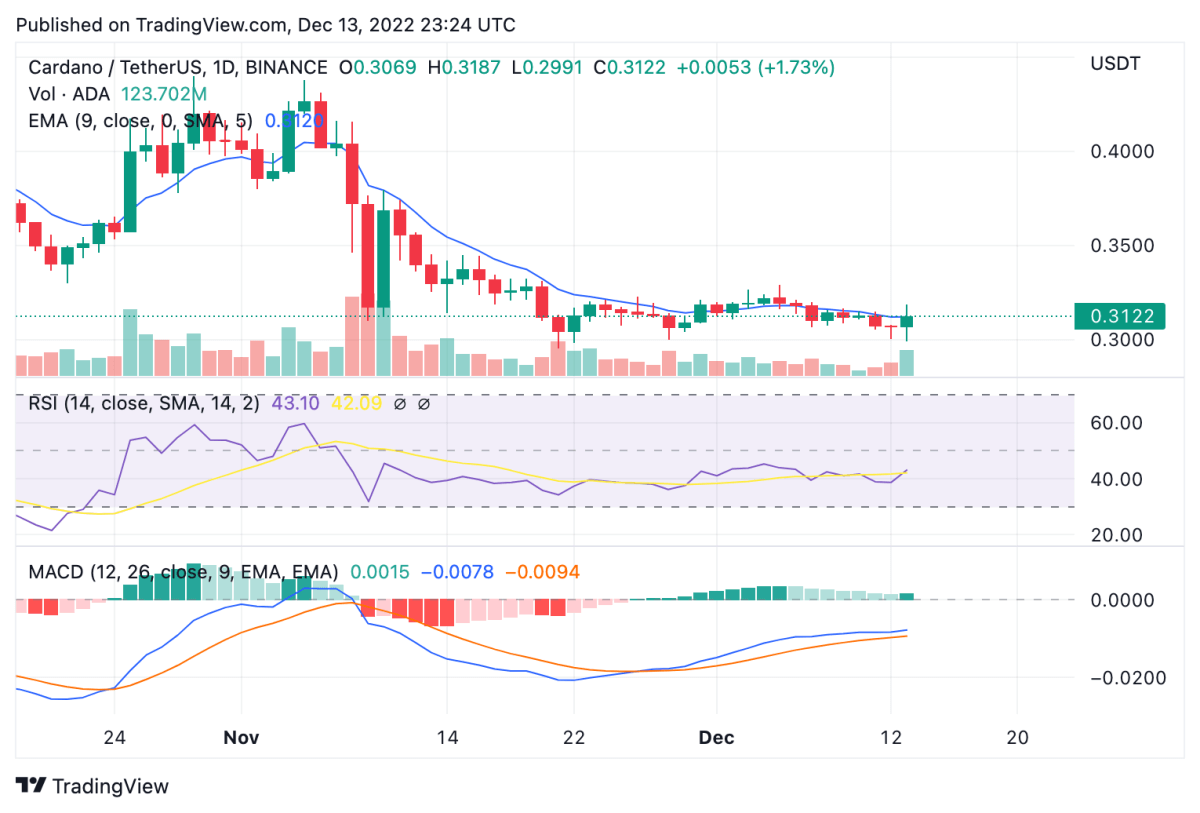
Cardano price analysis shows price action is to remain in bearish state, regardless of the 2 percent increment over yesterday’s price over the past 24 hours. ADA moved up to $0.319 today, before settling around $0.311 at just above yesterday’s price level. Increased volatility was observed in the larger crypto market today, as the market overall rose up to 3 percent. Cardano bulls may be inclined to buy the current dip to build rally up to $0.38. However, the current trend continues to show horizontal run that has been in place since November 24.
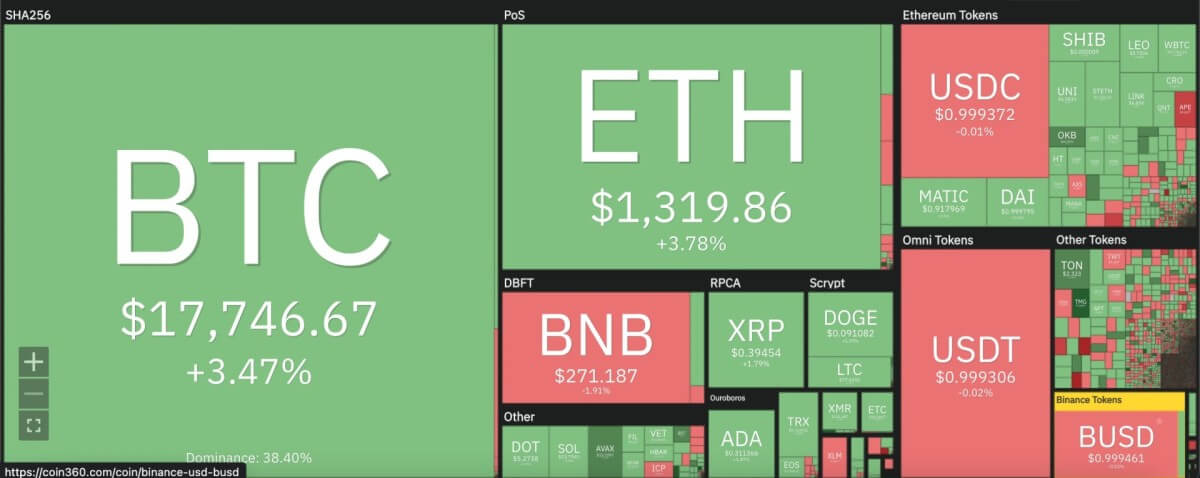
The larger cryptocurrency market showed increments across the board, as Bitcoin rallied past the $17,500 mark with a 3.5 percent increase. Meanwhile, Ethereum jumped 4 percent to move up to $1,300. Among leading Altcoins, Ripple rose 2 percent to $0.39, while Dogecoin stayed at $0.09. Polkadot and Solana rose 2 percent and 4 percent, respectively, while Avalanche token jumped 6 percent to move as high as $13.73.

Cardano price analysis: RSI head back upwards on daily chart
On the 24-hour candlestick chart for Cardano price analysis, price can be seen continuing along an extended horizontal trend that initiated on November 24, regardless of the minor increment incurred over the past 24 hours. The support zone at $0.30 has been home to ADA price for almost a month, without any build up towards a breakout. The next immediate resistance point sits at $0.38, if bulls can initiate a rally upwards. Over the current price action, however, price can be seen sitting below the 9 and 21-day moving averages, and the 50-day exponential moving average (EMA).

Cardano price analysis shows that trading volume over the past 24 hours rose over 69 percent, without significant uptrend in price. This indicates of the seller dominance in the market for ADA. However, the 24-hour relative strength index (RSI) can be seen heading back upwards before hitting the undervalued region in the 30’s. Currently at 43, it will need to increase past 50 to influence a bullish reflection on ADA price. Meanwhile, the moving average convergence divergence (MACD) curve remains on the fence in terms of a bullish or bearish divergence against the neutral zone.
Disclaimer. The information provided is not trading advice. Cryptopolitan.com holds no liability for any investments made based on the information provided on this page. We strongly recommend independent research and/or consultation with a qualified professional before making any investment decisions.Disclaimer. The information provided is not trading advice. Cryptopolitan.com holds no liability for any investments made based on the information provided on this page. We strongly recommend independent research and/or consultation with a qualified professional before making any investment decision.


