The latest Cardano price analysis shows a bullish signal for the digital asset as it retraces above the $0.3700 level. The bullish trend is driven by increasing market sentiment and higher volumes over the past few days. The buying pressure pushed the price of ADA to a high of $0.3732, which makes it an attractive target for bulls. On the flip side, ADA is trading well above the major support level at $0.3573. If this level holds, it could bring a median range of $0.3570-$0.3730 for Cardano in the near future. The key resistance level at $0.3700 is also a good milestone for the bulls to break. Stability above this level could provide further upside potential for ADA.
The trading volume has been significantly high today, which could indicate that the digital asset is more likely to retrace above the $0.3700 level. If the buying pressure continues, Cardano may even break out of the current resistance range and reach a new high in the near future. The trading volume stands at $173 million with a gain of more than 50 percent and the market capitalization is at $12.8 billion, according to CoinMarketCap.
Cardano price analysis daily chart: Bulls face resistance at $0.3732
The daily chart of Cardano price analysis shows an uptrend trading pattern for the crypto asset. Despite ADA trading below the $0.3600 mark the bulls managed to push the price above the $0.3700 level before a pullback to the $0.3680 level. The buyers need to break the $0.3732 resistance level to confirm an upside trend in ADA prices.
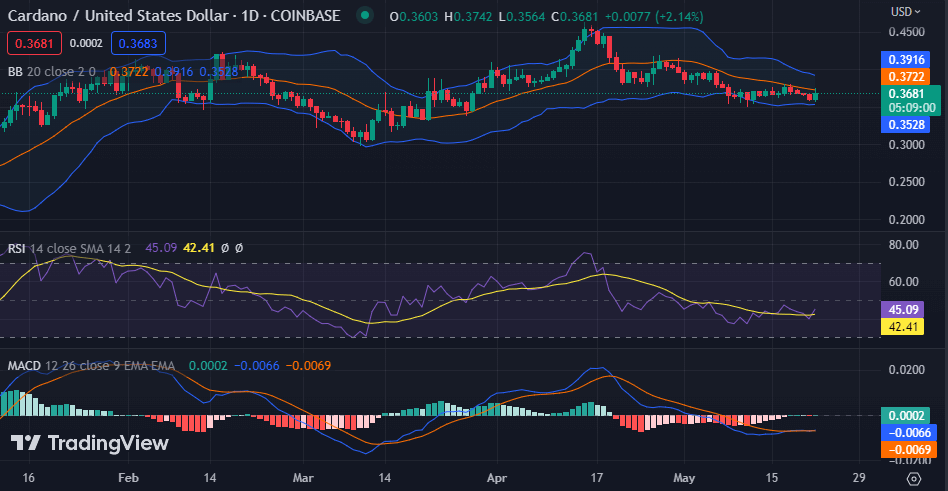
The Relative Strength Index (RSI) is at 45.09 and sloping upwards, which could be a sign of more upside potential in the digital asset. The MACD is trading near the zero level and may cross above to indicate an upward momentum for Cardano. The green bars in the histogram have started forming, which could also be a sign of a bullish trend in ADA prices. The Bollinger band indicator is still narrow but the green candlesticks have started forming on the chart, which could indicate a bullish breakout in the near future.
Cardano price analysis 4-hour chart: Recent developments and further indications
On the hourly chart Cardano price analysis, ADA is trading in a tight range of $0.3680-$0.3700. The buyers and sellers are in equilibrium, as the buyers try to push the price further above while the sellers attempt to keep it within a specific range. The buyers need to hold the upper hand in order to break the key resistance level of $0.3732.
The technical indicators on the 4-hour chart support the bullish sentiment in Cardano. The Relative Strength Index (RSI) is hovering above 50 index with a value of 55.31 displaying an increasing buying pressure in the market.
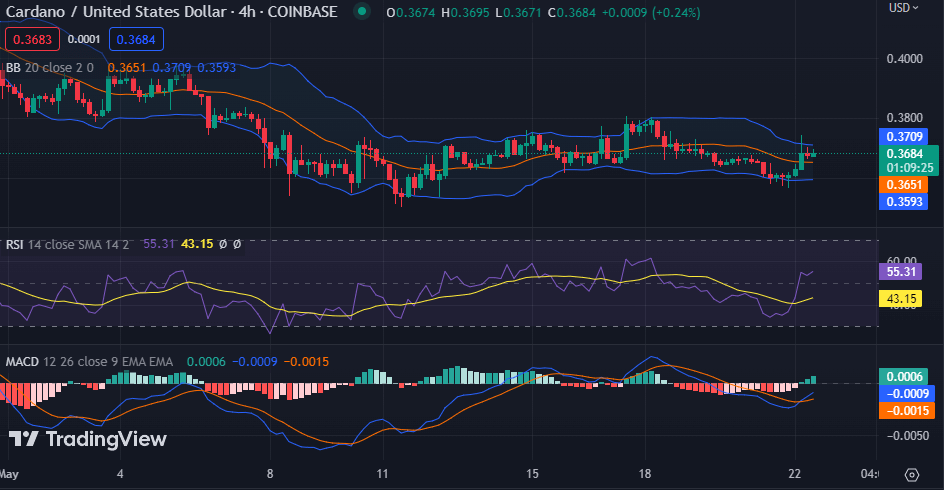
The MACD is in positive territory and is likely to attain a positive value if the current trend continues. The histogram is also in positive territory and could indicate a further upside if the buyers remain in control. With the green candlesticks growing higher on the chart, the Bollinger band is likely to widen, indicating a bullish breakout could be in the cards for ADA.
Cardano price analysis conclusion
Overall, the Cardano price analysis indicates that ADA is trading in positive territory and there could be more upside potential. If the buyers gain further strength and manage to push prices above $0.3732, then the digital asset might target the next resistance at $0.3800 or higher levels in coming sessions. The key support level for ADA remains at the $0.3500 mark and if that is breached, then a deeper correction may be seen in the near future.