Cardano price analysis indicates an increasing trend for cryptocurrency today. Although the price was facing bearish resistance earlier, the bulls have managed to bring the price above $0.365 in the last 24-hours as it has reached $0.0.371. The continuation of the green candlestick indicates that the coin value has been increasing once again for the second day consecutively.
The coin is up by 1.45 percent with a market capitalization of $12.70 billion, while the 24-hour trading volume of the coin has also increased and is currently at 386 million. The coin started the day at $ 5.41 and reached a high of $6.69.
Cardano price action on a daily chart
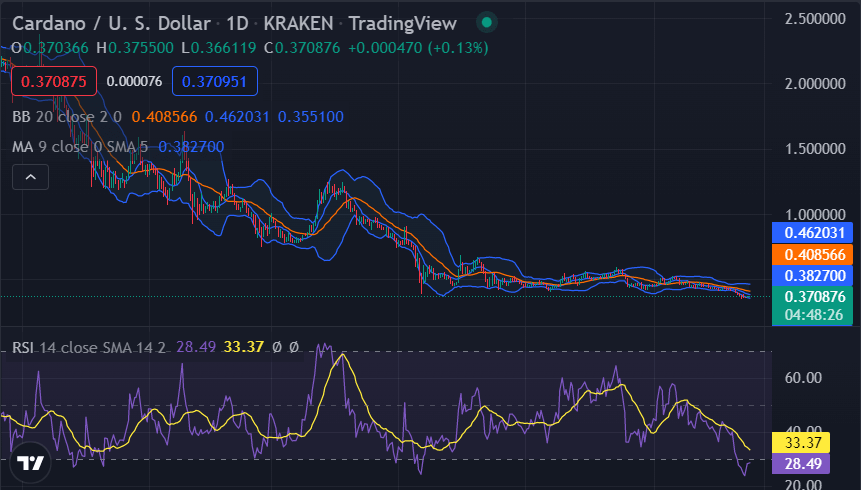
The daily Cardano price analysis gives encouraging news for the cryptocurrency buyers, as the price has increased significantly during the day. The coin is currently trading at $0.371 at the time of writing, and chances are there for further increases in price levels. The price trends have been undergoing constant variation for the past week, but now a continuation of the bullish trend can be seen on the price chart, which has gained strength today. The moving average (MA) value is found standing at the $0.3827 position.

The volatility is relatively on the decreasing side. Bollinger bands’ upper value is 0.3753 representing the resistance for ADA, whereas the lower value is $0.365 representing the strongest support for ADA. The Relative Strength Index (RSI) graph shows an upward curve as the buying activity intensified in the market, and the RSI level has reached an index of 33.37 in the lower half of the neutral zone.
Cardano price analysis on a 4-hour price chart
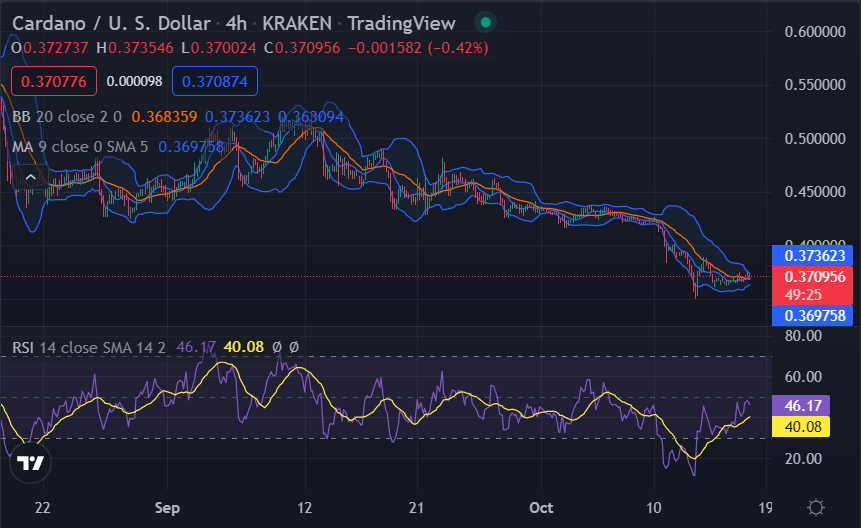
The 4-hour Cardano price analysis shows that the price made higher highs and higher lows, which is a bullish trend. The cryptocurrency has now broken out of the descending channel that it has been trading in since last week. The breakout is a positive development and indicates that the bulls are in control of the market. The moving average value in the four-hour price chart is standing at the $0.3697 level.

A crossover between the SMA 50 and the SMA 20 curves were recorded in the previous hours, but now the bulls are trying to recover their position. The upper band of the Bollinger bands indicator is present at the $0.373 mark, and the price is way above then the upper band, whereas the lower band is present at the $0.369mark. The RSI graph shows a bullish curve as the indicator has reached the border of the overbought region at index 40.08.
Cardano price analysis conclusion
To conclude, Cardano price analysis reveals that the cryptocurrency follows an upward trend with much room for activity on the positive extreme. The market looks to be in a bullish trend as the 24-hour chart and 4-hour technical indicators point to more gains. Investors are advised to buy the dips as the market looks set to continue higher.
Disclaimer. The information provided is not trading advice. Cryptopolitan.com holds no liability for any investments made based on the information provided on this page. We strongly recommend independent research and/or consultation with a qualified professional before making any investment decisions.


