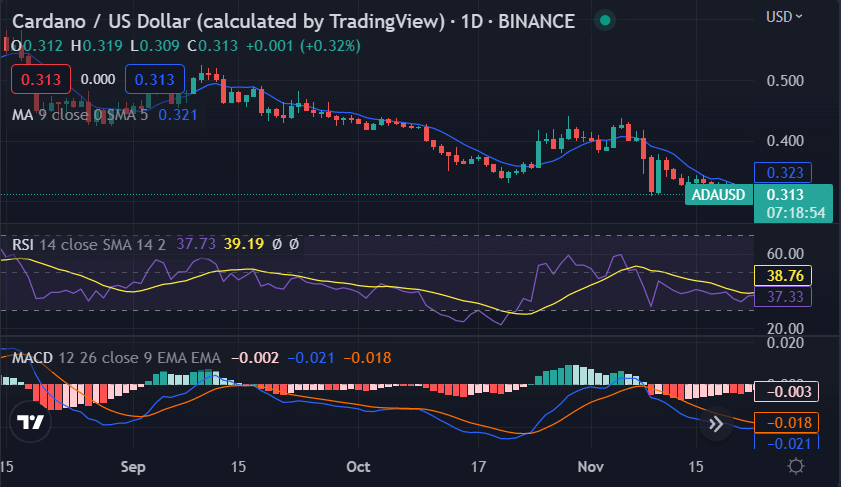
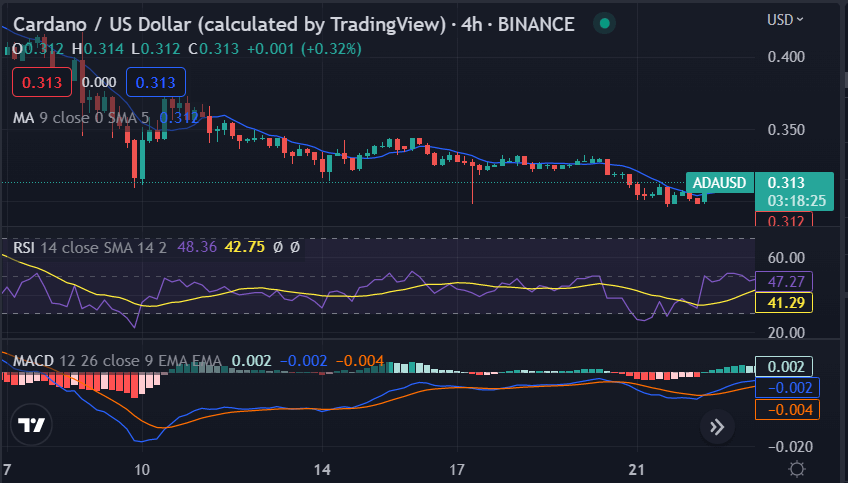
Cardano price analysis reveals the digital asset opened the daily trading session on a bullish note at $0.3133, up from the previous day’s close of $0.3050 against the US dollar. The price quickly moved toward the $0.325 resistance level and faced stiff rejection at that point. Nevertheless, there is still support for Cardano at the $0.30 level which prevented a further decline in price action over the weekend.
At the time of writing, the price of Cardano is hovering around $0.3133, representing a 0.2% increase from yesterday’s close. Looking ahead, we can expect ADA to stabilize at this level as it continues its journey into the long-term bull run. On the downside, key support levels are likely to be formed near $0.30, with subsequent levels near the $0.285 and $0.275 marks.
Cardano price analysis on a daily chart: Bullish momentum builds up
Cardano price analysis on a daily chart shows an uptrend that has pushed the price above the $0.295 and $0.30 resistance levels in recent days. Cardano is likely to continue its journey higher as bullish momentum builds up and investors look to buy ADA at lower prices.
The MACD indicator, which measures buying and selling of assets by traders, also suggests a continuation of the uptrend in price action. The Cardano price has been on a steady uptrend over the past few hours, as investors continue to flock to this promising digital asset. However, we can see that ADA is now facing some resistance at the $0.325 level, having failed to break above this key psychological level multiple times in recent days. Despite this, there is still a positive outlook for the Cardano price going forward.

The Simple Moving Average shows that Cardano is now above the 20-day SMA, signaling a continuation of the uptrend. Moreover, the MACD indicator is moving in favor of the bulls, suggesting that it will overcome resistance and continue its journey to higher prices.
Cardano price analysis on a 4-hour chart: Bullish pennant pattern forms
Cardano price analysis on a 4-hour chart shows that the digital asset has now formed a bullish pennant pattern following its recent bull run to $0.325. This is an extremely positive signal for ADA as it suggests further upside in the coming days.

The RSI indicator, which measures buying and selling pressure of an asset, is also showing a strong bullish trend. However, we need to see ADA break above the $0.325 resistance level for this pattern to be validated by technical analysts. The EMA indicators on the 4-hour chart are also showing that Cardano is strongly bullish in the short term. Overall, the outlook for ADA remains positive as it continues its journey toward higher prices over the long term.
Cardano price analysis conclusion
Cardano price analysis shows that this digital asset has been on a steady uptrend in recent hours as the entire cryptocurrency market sentiment has improved. In the coming days, we can expect ADA to continue its journey higher as bullish momentum builds up and investors flock to this promising asset at lower prices.
Disclaimer. The information provided is not trading advice. Cryptopolitan.com holds no liability for any investments made based on the information provided on this page. We strongly recommend independent research and consultation with a qualified professional before making any investment decisions.


