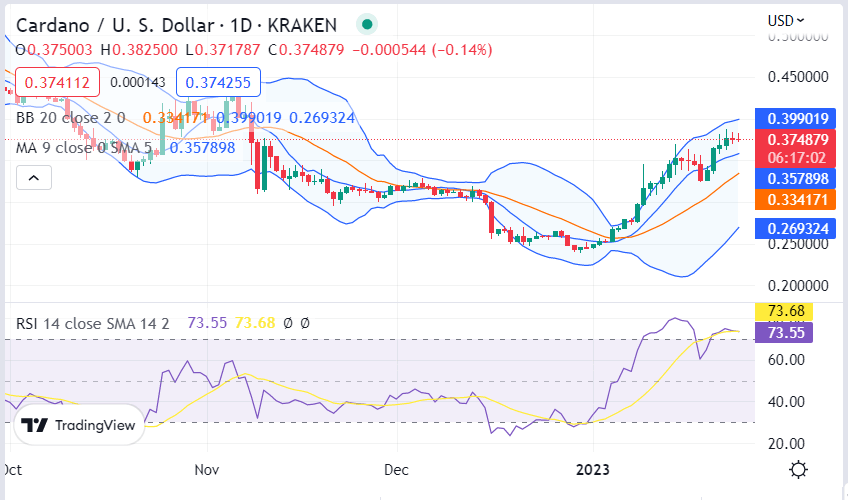
Cardano price analysis is in a bearish direction today. The bears have been dominating as the price has again decreased to $0.3744. The bearish trend had cast quite negative effects on the cryptocurrency’s value as the larger trend has been bearish for a long time. Today’s start of the trading section the bulls were dominating the price as the price increased to $0.3825 but the bullish momentum was not able to sustain and the bears have taken control over the market.
The selling pressure has been increasing as the price has decreased to $0.3718 which is acting as a support level for the ADA/USD pair. The bulls might face a tough time in the market as the bears are still dominating. Traders should be cautious and not enter into any trades without proper market analysis.
ADA/USD 1-day price chart: Bears leading the price function
The 1-day price chart for Cardano price analysis shows bears are leading the charts for today as the bears have been able to make a breakthrough after the bullish trend of earlier today, and as a result, the price is going down again, and the coin is trading at $0.3744 at the time of writing. The bearish trend has been strengthening for the past few weeks, and the moving average (MA) has come down to $0.3578.

The Bollinger bands show high volatility as they expand and cover more areas. The upper band has reached $0.3990, and the lower band has reached the $0.2693 mark. The relative strength index (RSI) shows a downward slope as it is trading near the border of the oversold region at index 73.68. The RSI shows the ADA is in high bearish pressure and hasn’t found the support to break out of it.
Cardano price analysis 4-hour: Recent updates
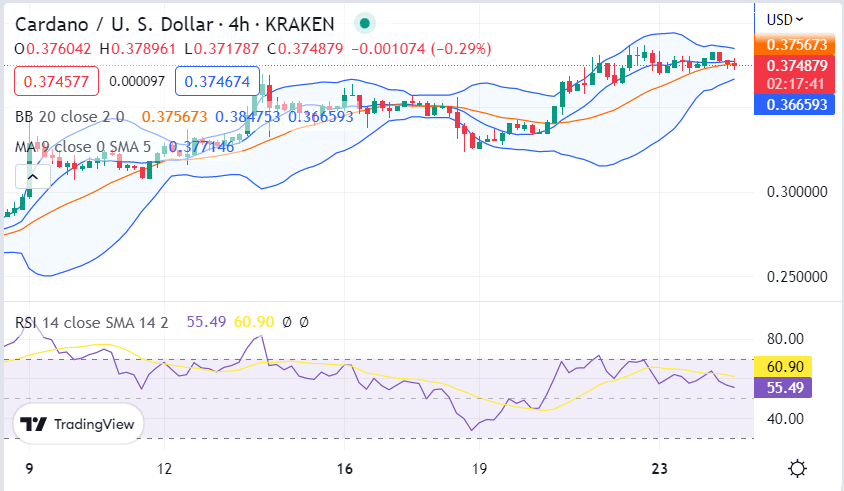
The 4-hour price chart for Cardano price analysis shows the bulls are putting their efforts to elevate the price recently. After the price broke downwards today, the bears plunged it down to $0.3744, but the coin rejected further downside, and the price returned to $0.3775, from where it is currently trading at $0.3753. The recent updates also show that the bulls are trying to make a move as the loss is going and the bouncing back from the support level.

The moving average is trading at $0.3771, and the Bollinger bands indicate high volatility as they widen and cover more area. The upper band has reached $0.3847, and the lower band is at $0.3665. The RSI shows the pressure is still in favor of the bears as it is trading near the oversold region at index 60.90.
Cardano price analysis conclusion
To Conclude, the Cardano price analysis shows the coin is under high bearish pressure, and traders should be cautious while entering into any trade. The bulls are trying to make a move, but the current market situation is not in their favor. The price has broken the support level and is trading near the oversold region.


