Cardano price analysis shows a bearish trend in the cryptocurrency market today. Cardano prices are currently trading above key support at $0.3282, and a breakdown to this level could signal further declines toward the next major support at $0.3363.
The bearish wave is being driven by strong selling pressure from investors, who are concerned about the potentially negative impact of regulatory uncertainty on cryptocurrency markets. However, if Cardano prices can hold above key support at $0.3282 and climb higher, we could see a reversal in market sentiment and a rally toward the next resistance level at $0.3454.
ADA/USD 1-day price chart: Bearish wave extends after a brief interval
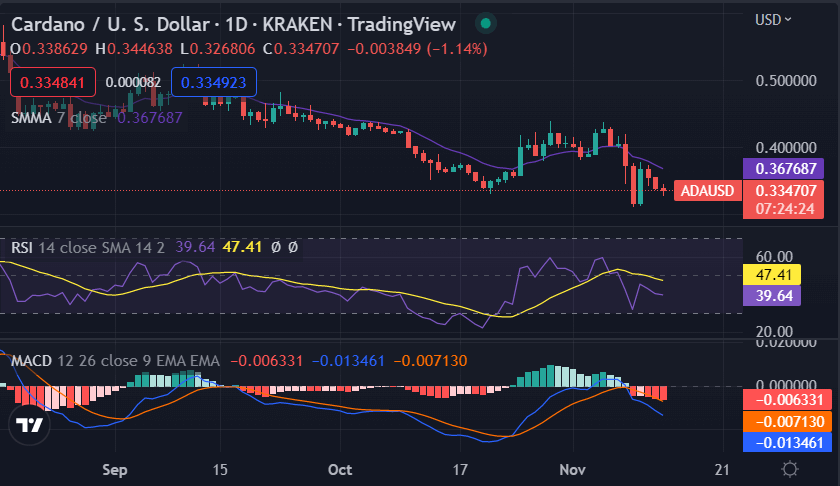
The 24-hour Cardano price analysis shows that a bearish trend currently controls the market as a loss in coin value is observed. The price underwent recovery in the last two days, but now the declining trend is getting quite stronger. The short-term trending line is again moving in the descending direction, and the ADA/USD value is now standing at $0.3363 with a decrease of 2.31% in the last 24 hours. The 24-hour trading volume of ADA is $367 million, with a market capitalization of $11.56 billion.

The Simple moving average of 50 and 100 is moving down, indicating strong selling pressure on the crypto. The MACD line has crossed downwards from above zero level. There are chances of more reduction in value if the bears keep pushing strongly. As for indicators, the RSI is at 47.41 levels, showing that it is neither oversold nor overbought right now.
Cardano price analysis: Price steps up to $0.3363 as the downtrend follows
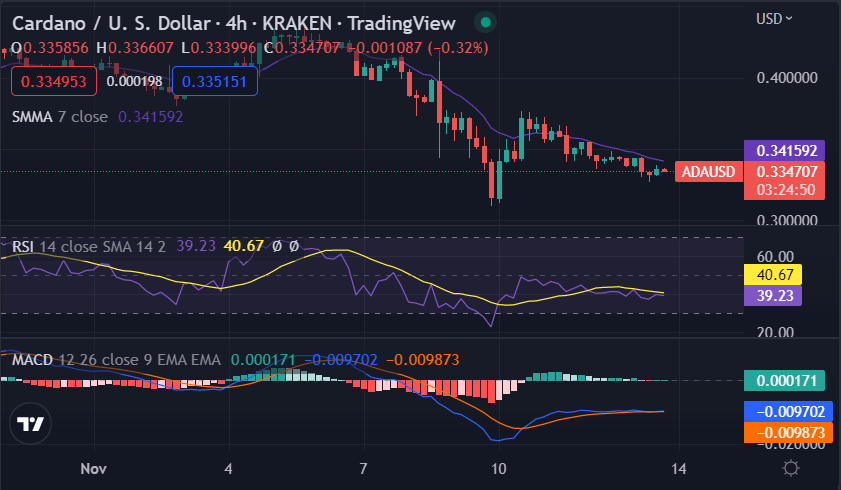
The 4-hour Cardano price analysis shows that the cryptocurrency is still in a downtrend and the recovery was short-lived. The price reached $0.3363, but it could not sustain its momentum and fell to $0.3250 with a minor drop. The ADA/USD pair is currently trading in a range of $0.3250-$ 0.3363, for the last 4 hours.

The SMA of 100 is moving in the descending direction, while the SMA of 50 shows some recovery attempts. The RSI graph shows an ascending curve due to the latest bullish strike, and the score has climbed up to $40.67. The ascending triangle pattern is also showing signs of a future breakout with the MACD line moving more upward than before.
Cardano price analysis
To conclude, the Cardano price analysis shows bearish market conditions for the cryptocurrency, with further declines likely in the short term. However, if Cardano prices can break above key resistance at $0.3454, we could see a reversal in market sentiment and a rally toward more sustainable levels.
Disclaimer. The information provided is not trading advice. Cryptopolitan.com holds no liability for any investments made based on the information provided on this page. We strongly recommend independent research and/or consultation with a qualified professional before making any investment decisions.


