Cardano price analysis is bearish as the crypto’s value has dropped below the $0.30 level. ADA/USD is currently trading at $0.2859 after a brief period of consolidation between $0.28 and $0.30. The ADA/USD pair had earlier found support at $0.2854 but was unable to move higher and breached below it. The resistance for ADA/USD lies at $0.3026, which, if broken, can lead to a move toward the $0.3030 Resistance level.
The ADA price analysis has decreased by 5.70 percent in the past 24 hours. The market capitalization for the crypto is currently at $9.83 billion, and the 24-hour trading volume for ADA is $294 million.
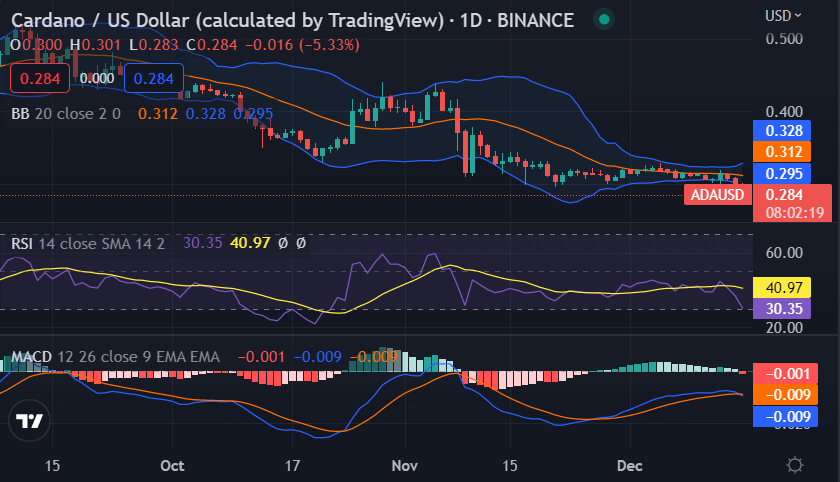
Cardano price analysis for 1-day price chart: Support for ADA/USD is present at $0.2845
The 1-day Cardano price analysis chart shows that the crypto has been on a downtrend for the last 24 hours. The bears have been in control of the markets after encountering bullish pressure around $0.32. Since then, the price has been on a downward spiral and is currently trading below the $0.3026 resistance level. The bearish momentum has been continuing over the past two days, and today, the trend is the same. The price has been lowered to the $0.2859 level after the latest drop.

The moving averages shown on the 1-day chart are bearish as the 50-day moving average has crossed below the 200-day moving average. This indicates that the market is in a bearish phase, and the prices are likely to continue to fall. The Relative Strength Index is at 40.97 and is close to the oversold zone, which indicates that the prices are likely to see a bounce back in the near future. The Bollinger bands are also close to each other, which indicates that the market is consolidating and a breakout is likely to happen soon.
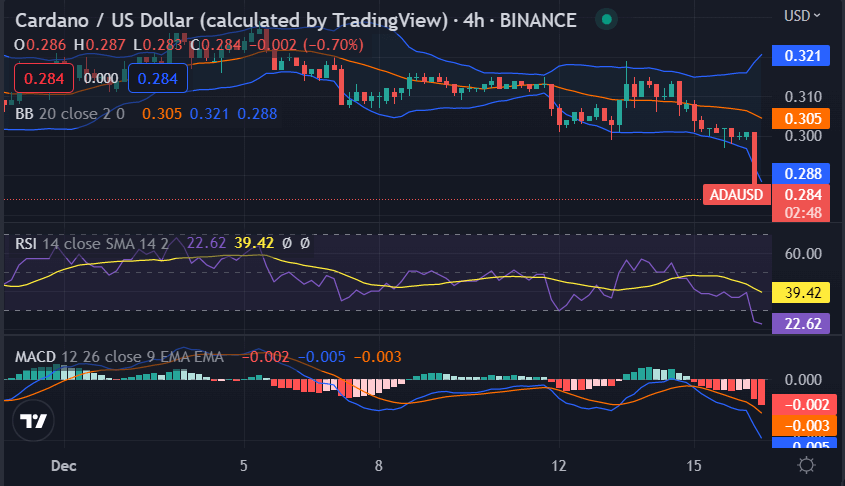
ADA/USD 4-hour price analysis: Latest developments
Cardano price analysis reveals the market’s volatility following an opening movement. This means that the price of Cardano is becoming more prone to the movement towards either extreme, showing further declining dynamics. The Bollinger’s band’s upper limit is $0.31, while the lower boundary at $0.288 coincides with the current market price and immediate support level.

Cardano price analysis shows the Relative Strength Index (RSI) indicator is at the oversold zone with a value of 39.42. This means that ADA is undervalued at the moment, and a price rebound may occur in the near term, pushing the asset’s price up to around $0.28. However, if the RSI keeps falling, it will confirm a downtrend and might lead to a new ADA all-time low. The 50-MA is located at $0.305 and continues to decline, while the 200-MA is located much further below at $0.288. This indicates that the general market trend is bearish in the mid-term.
Cardano price analysis conclusion
Cardano price analysis reveals the cryptocurrency to follow a strong downward trend with much more room for bearish activity. However, the bears have currently taken over the market, and the declining volatility favors the bears. As a result, they are likely to push prices toward $0.2845 in the near term.
Disclaimer. The information provided is not trading advice. Cryptopolitan.com holds no liability for any investments made based on the information provided on this page. We strongly recommend independent research and/or consultation with a qualified professional before making any investment decisions.


