Cardano price analysis reveals the price has been trading high for the past few hours as the bulls have been putting efforts to remain at the lead. An uptrend has been observed today as well, as the price has increased to the $0.3196 level as the bulls have maintained their strength. Resistance for ADA/USD can be found at $0.3212, and support can be located at $0.3125. Going forward, we expect the price to continue increasing in value, as long as the bulls remain bullish in the market.
The digital asset has increased by more than 1.23% today and the market capitalization of Cardano stands at $11 billion currently, While the 24 trading volume has also increased to over $190 million, we believe that the cryptocurrency is likely to stay bullish in the coming days as well.
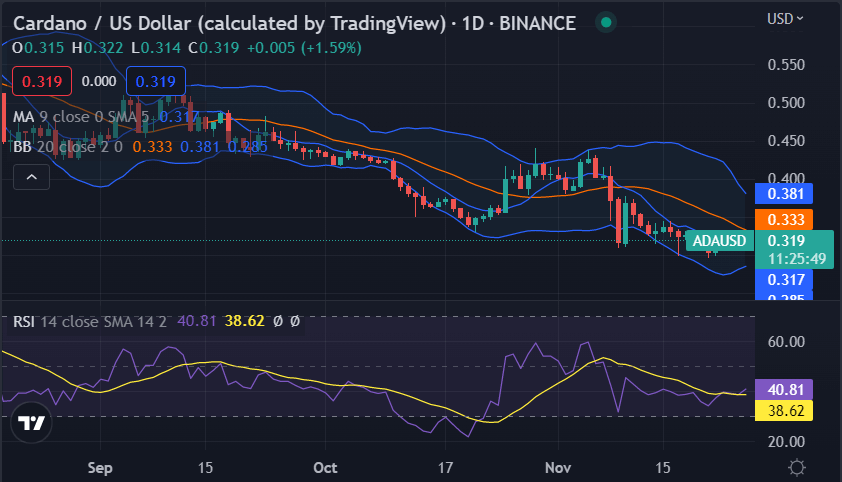
ADA/USD 1-day price chart: ADA recovers up to $0.3196 as bulls steer safely
The one-day Cardano price analysis confirms an upward price movement for today, as the price has increased to $0.3196. The price has been experiencing bullish momentum for the past few days, however, the bearish pressure was strong enough to bring the price down. The bulls were able to make a comeback today and managed to push the price upward as support can be found at $0.3125. Going forward, we expect the price of ADA to continue increasing in value, as long as the bulls remain strong in the market.

The price has gone above the upper value of the Bollinger bands, and the moving average (MA) is trading at $0.317 below the price level. The volatility has increased during the day, which is yet another bullish sign. As a result, the upper Bollinger band value has now moved up to $0.333, whereas the lower Bollinger band value moved down to $0.312. The Relative Strength Index (RSI) score has undergone an increase as well as it is now at index 38.62 on a steep upwards curve indicating the intense buying activity in the market.
Cardano price analysis: Recent developments and further technical indications
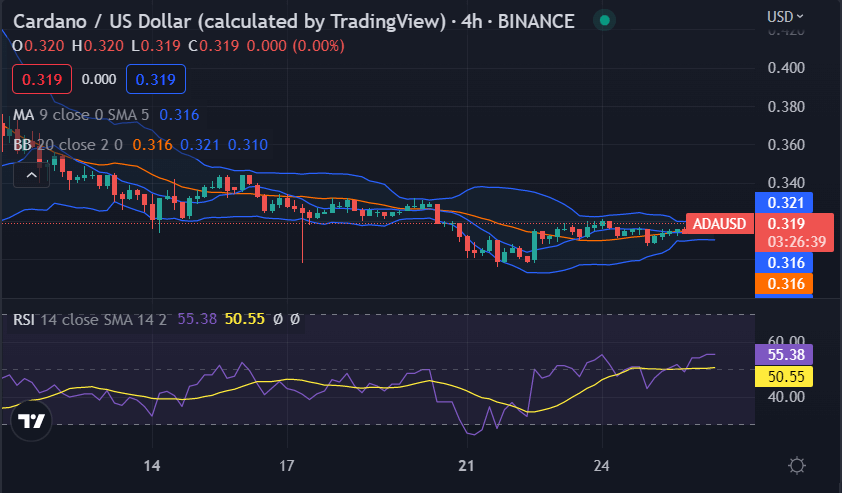
The four hours Cardano price analysis is declaring the bullish lead as the price has improved consistently. Since the past few hours, an upward trend has been observed as the price has moved up to the $0.3196 level. The price has increased significantly as the bullish momentum has been intensifying since yesterday. The moving average, in the four hours price chart, is standing at the $0.316 level above SMA 50.

The increase in volatility has changed the upper Bollinger band value to $0.321` and the lower Bollinger band value to $0.310, indicating high volatility. The RSI is continuing its upward curve at an index of 50.55 on the border of the neutral zone.
Cardano price analysis conclusion
To sum up, the Cardano price analysis is indicating a bullish trend for today. However, it is likely that the price might experience some temporary volatility in the near future as well. As long as the bulls remain strong and continue driving the market forward, we expect the price to increase further in value.
Disclaimer. The information provided is not trading advice. Cryptopolitan.com holds no liability for any investments made based on the information provided on this page. We strongly recommend independent research and/or consultation with a qualified professional before making any investment decisions.


