Chainlink price analysis, the bullish side is ruling the market, with the price increasing on a regular basis. This is seen through its daily uptrend, with support present at $7.68 and resistance at $8.31. The LINK/USD is currently trading at $8.20, showing a strong push from buyers in the market, with an increase in demand for the cryptocurrency.
The bulls and the bears are currently in a battle for control of the market, but with the bullish momentum pushing prices higher, it shows that buyers are currently dominating. This could potentially lead to a break above resistance and further price increases for Chainlink.
LINK/USD 1-day price chart: Green signal for buyers as bulls continue ruling
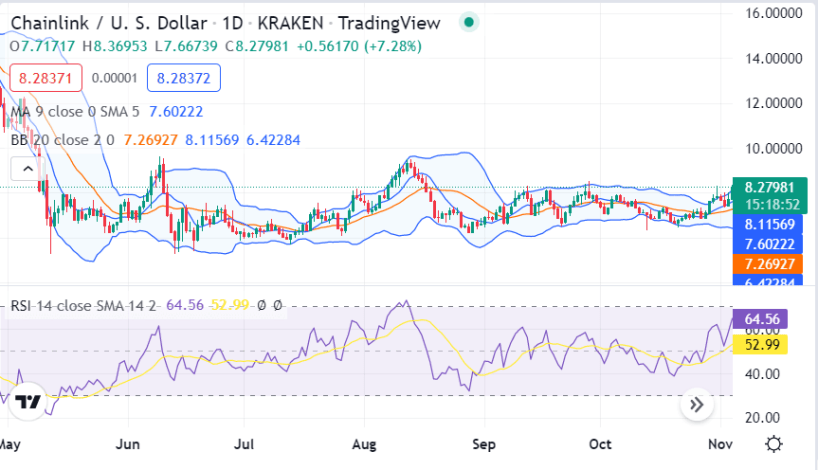
The 1-day price chart for Chainlink price analysis shows bullish signs, with the price levels increasing, although the past week has been unfavorable for the bulls as the price levels have continued to decrease. Yet, today the trend is upward, and the price has recovered up to $8.20. The coin reports an increase in value by 4.65 percent for the last 24 hours. The market cap for Chainlink is $4,039,427,896 and has a 24-hour trading volume of $663,649,017.

The moving average (MA) has traveled to $7,60, which is still higher than the current price level. The Bollinger bands are maintaining their values, indicating no notable change in the volatility and reaching an average value of $7.26. The upper Bollinger band is present at a value of $8.11, and the lower band is at a value of $6.42, The 1-day candlestick chart shows the RSI index of 52.99, and the upwards slope of the indicator hints at the buying activity in the market.
Chainlink price analysis: Recent developments and further technical indications
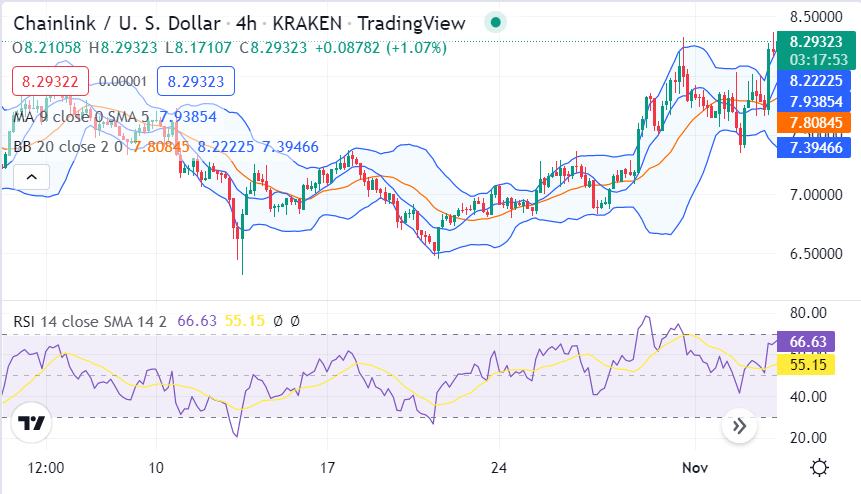
The 4-hour Chainlink price analysis is going in the bullish direction with the resistance also present at the current price level of $8.20. During the past hours, the price function has been under the control of bulls, yet the bulls have to make a breakthrough above $8.31. The moving average has jumped higher to the value of $7.93. At the same time, the mean value of Bollinger bands has reached the figure of $7.80.

The volatility is comparatively high as the Bollinger bands are covering more area, which is a positive indication for the future. The upper value of Bollinger bands is $8.22, while the lower value is $7.39 in the 4-hours LINK/USD price chart. The Relative Strength Index (RSI) is currently trading at index 55.15 in the lower half of the neutral zone. However, the curve of the indicator is getting horizontal, which hints at the resistance from the bearish side.
Chainlink price analysis Conclusion
The Chainlink price analysis is showing increasing momentum for the bulls. The resistance is present at the $8.31 level and may be crossed by cryptocurrency if today’s trend continues in the coming hours. Major shifts in market trends are expected as more and more buyers enter the market. However, the cryptocurrency may go into correction for a few hours as the RSI curve in the 4-hour chart is flattening up.
Disclaimer. The information provided is not trading advice. Cryptopolitan.com holds no liability for any investments made based on the information provided on this page. We strongly recommend independent research and/or consultation with a qualified professional before making any investment decisions.


