The Chainlink price analysis report currently shows a bulls activity as prices have risen significantly to hit the $6.86 mark. After a brief period of fall, the bulls have kept up their momentum and are currently making a further recovery. Since 21 November 2022, LINK’s overall trend has been in the rising direction. Recent bullish activity has been less, but purchasing pressure has grown as the price has increased. Since the price oscillation has already slowed down, the next resistance for LINK is situated at $7.02, which is also where the selling pressure may reappear.
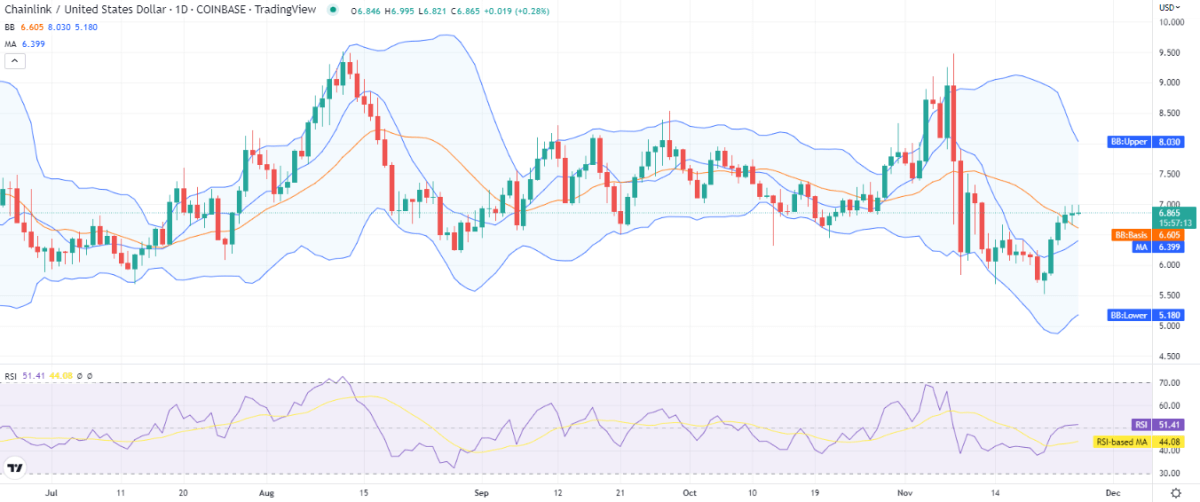
LINK/USD 1-day price chart: LINK reports nominal gains of 0.64 percent.
According to the 1-day Chainlink price analysis, the coin is bullish, as evidenced by the price function for today. LINK/USD only fluctuated between $6.81 and $6.99. As of this writing, the coin is changing hands for $6.86, showing a value rise of 0.64 percent over the previous day. It revealed a growth of 12.93% over the previous week. the market cap also increased by 0.62 percent, and the market dominance for LINK/USD was recorded at 0.41 percent.

The relative strength index (RSI) suggests that the buyers have not contributed much to the coin’s value, as the RSI curve is almost horizontal and the RSI score is 51. The moving average (MA) is trading below the price level of $6.39, as the SMA 20 continues trading below the SMA 50 curve.
LINK/USD shows highl volatility, with the upper limit of the Bollinger bands now trading at $8, representing resistance. The lower limit of the indicator is present at the $5.18 mark, representing support for the cryptocurrency. The average centerline of the Bollinger bands is currently at $6.60.
Chainlink price analysis: recent developments and further technical indications
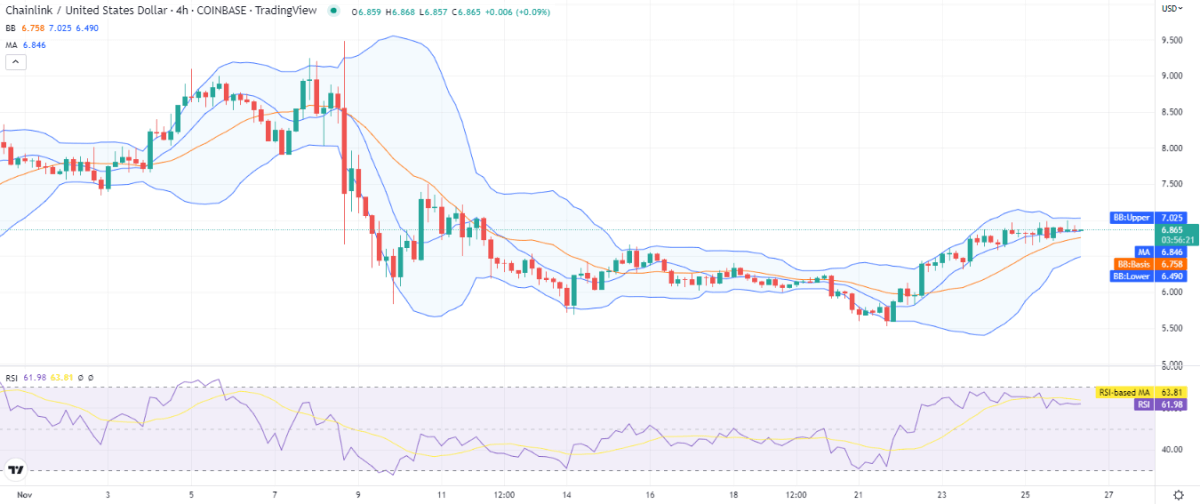
The 4-hour price chart for Chainlink price analysis shows slow bullish activity on the charts as the price function is flattening out near the current price level as selling pressure seems to be triggering after short intervals. After the correction observed four hours ago, the bulls are back in the lead. The trend is still bullish today, as the bulls dominated the market most of the time and are currently leading the price action.

The SMA 20 is trading above the SMA 50, and the 4-hour chart shows only moderate volatility. The Bollinger bands upper and lower bounds are both present at $7 and $6.49, respectively. The hourly chart’s RSI is currently trading at 61, and the flat curve suggests that the two sides of the market are in rivalry.
Chainlink price analysis conclusion
Overall, the Chainlink price analysis indicates that the coin is currently trading on the positive side since bulls are in charge of the price movement. Even if LINK might not be able to overcome the $7 resistance during the current trading session, we anticipate it to keep its upward momentum today.
Disclaimer. The information provided is not trading advice. Cryptopolitan.com holds no liability for any investments made based on the information provided on this page. We strongly recommend independent research and/or consultation with a qualified professional before making any investment decisions.


