Given that the price of the cryptocurrency has significantly recovered today, the most recent chainlink price analysis favors the bulls. Despite the slow price fluctuation and the bears’ attempts to secure the ascendant on the price chart by reducing the token value, the bullish trend has persisted. The fact that the price is once more approaching the $7.03 level is encouraging for investors. If buyers are tenacious, additional recovery appears feasible as well.
LINK/USD 1-day price chart: Positive trend raises the price to $7.03
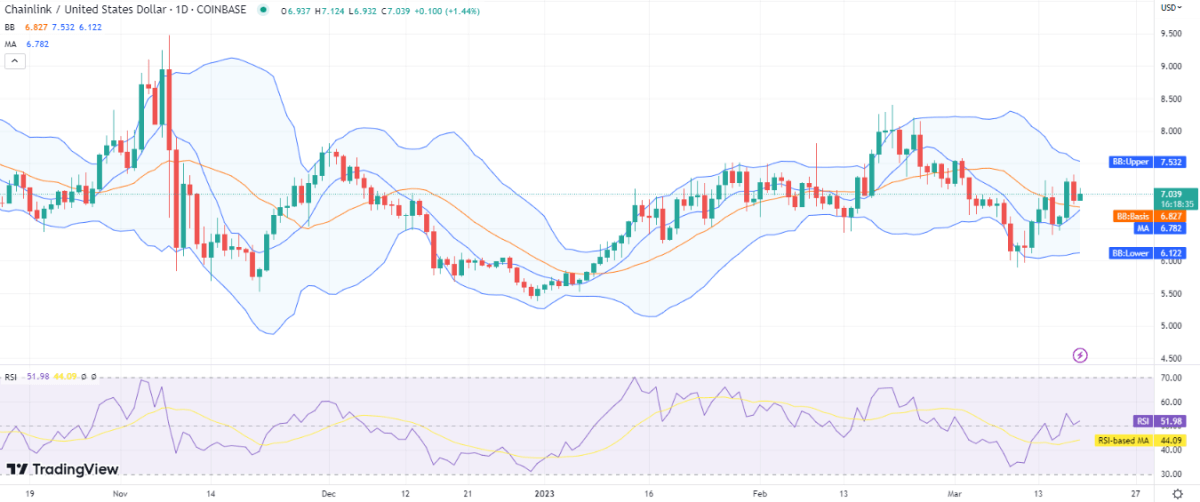
Given that there has been a relative increase in purchasing activity over selling over the last 24 hours, the daily Chainlink price analysis indicates a bullish momentum. If we look at the bigger picture, it appears that the price trends are once again shifting in favor of the buyers. The price seems more stable and is keeping its level. Earlier, a downward shock dissipated the price levels as the bulls were encountering heavy resistance from the bearish side. The coin’s worth has increased to $7.03, and the price is still trading above the $6.78 level of the moving average (MA) number.

Additionally, there is a lot of volatility, which is positive for buyers in terms of future market trends. Similar to this, the Bollinger bands indicator’s higher edge, which represents the resistance, is currently resting at $7.53, while its lower edge, which represents the strongest support, is resting at $6.12. The Bollinger bands also shows a $6.82 average at this moment. The relative strength indicator (RSI), which indicates the buying activity in the market, is on an upward curve at index 51.
Chainlink price analysis: Recent developments and further technical indications
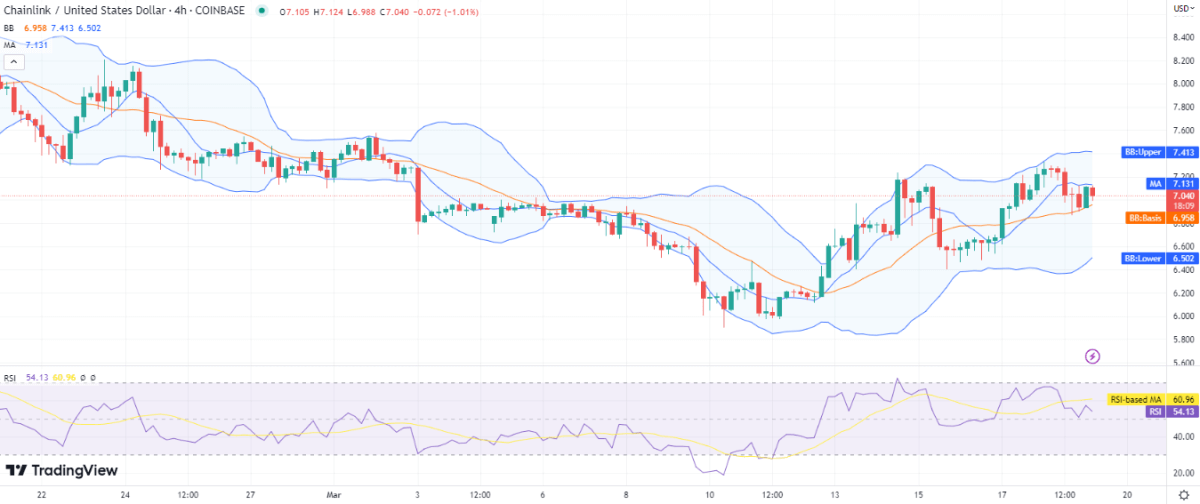
Despite the price having recently decreased a little, the four-hour Chainlink price analysis shows an increasing trend because there has been relatively more upward movement today. The four-hour price chart, where the green candlestick is bigger than the red one and denotes an increase in coin value, confirms this. The price was successfully brought above the $7 margin thanks to the bullish momentum, and it now appears that the bulls will shortly retake the lead. The moving average indicator is currently sitting at $7.13 on the four-hour price chart.

The Bollinger bands are expanding, which indicates a high level of volatility and frequent market changes. The higher value of the Bollinger bands indicator is now at $7.41, whereas its lower value is at $6.50. The RSI score increased to index 57 but has since decreased to index 55 due to the most recent price decline suggesting current selling activity.
Chainlink price analysis conclusion
As the coin’s backing manifests, the Chainlink price analysis forecasts an upward trajectory for the cryptocurrency. By increasing the coin value to a $7.03 figure, the bulls have been able to fend off bearish pressure. The market worth of cryptocurrencies, which has risen throughout the day, is represented by a green candlestick on the daily price chart.


