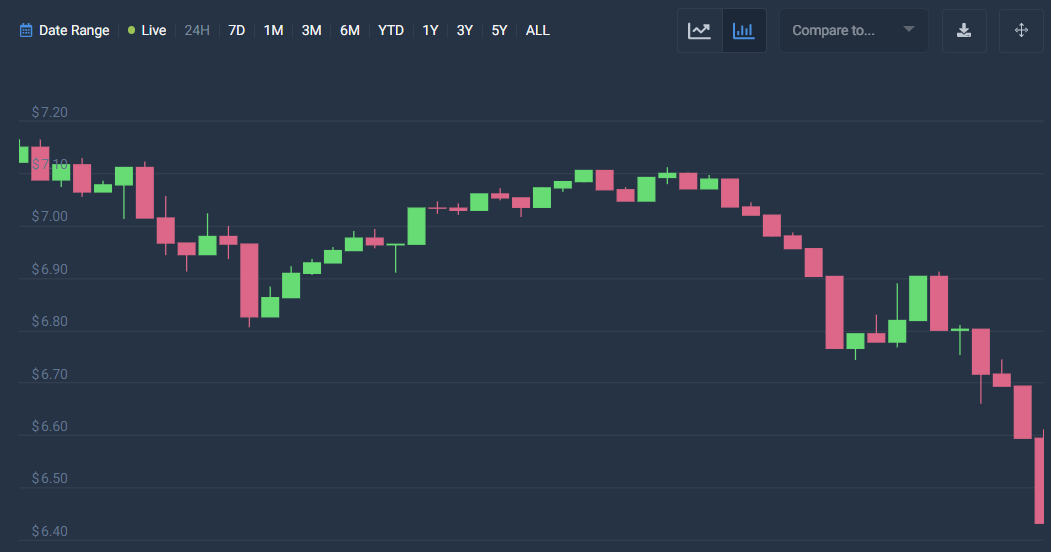
ChainLink price analysis for March 15, 2023, indicates a significant decline in the market, with negative momentum. The price of LINK has been consistently bearish in the past few hours, dropping from $7.1 to $6.8 on March 14, 2023. However, the market continued to decline and the price of ChainLink dropped even further to reach $6.4, just barely surpassing the $6.5 threshold.
As of March 15, 2023, the price of Chainlink (LINK) is $6.47 with a 24-hour trading volume of $1.04B and a market capitalization of $3.35B. Its market dominance is currently 0.31%, and the price has decreased by 8.98% in the last 24 hours.
Chainlink’s all-time high was on May 10, 2021, when it reached $52.89, and its all-time low was on September 23, 2017, when it traded at $0.126297. Since its all-time high, the lowest price for Chainlink was $5.36, and the highest price since then was $9.45.
The current sentiment for Chainlink’s price prediction is bearish, and the Fear & Greed Index is currently at 50, indicating a neutral sentiment. Chainlink’s circulating supply is currently at 517.10M LINK out of a maximum supply of 1.00B LINK. The current yearly supply inflation rate is 10.73%, which means that 50.09M LINK tokens were created in the last year. Chainlink is currently ranked #4 in the DeFi Coins sector and #7 in the Ethereum (ERC20) Tokens sector in terms of market capitalization.
LINK/USD 1-day price analysis: Latest developments
ChainLink price analysis shows a volatile market, with a downward trend. This implies that the price of ChainLink is showing fewer dynamics toward change. The opening price of ChainLink is recorded at $6.55, with the highest price also being $6.58. However, the lowest price recorded is $6.42, and the close price remains at $6.48. Currently, the ChainLink market is experiencing a decline of -1.15%.
The price of LINK/USD is currently below the Moving Average, indicating a bearish trend in the market. The market seems to be dominated by sellers, and the price of LINK/USD is declining, indicating a downward trend. The market is displaying a bearish outlook with significant potential for further decline.

ChainLink price analysis reveals that the Relative Strength Index (RSI) is 42 showing a stable cryptocurrency market. ChainLink is currently experiencing a phase of devaluation where its value is decreasing. This is supported by the downward trend of the Relative Strength Index (RSI), which is an important technical indicator that measures the strength of buying and selling activities in the market. The RSI score is decreasing due to the dominance of selling activities, which is further contributing to the downward movement in the market.
ChainLink price analysis for 7-days
Upon conducting a ChainLink price analysis, it can be observed that the market is currently experiencing volatility after a period of decline. This indicates that the price of ChainLink is becoming less susceptible to extreme changes in either direction. The opening price is recorded at $6.80, with the highest price being $6.91. On the other hand, the lowest price is present at $6.42, depicting a change of -4.55%, while the close price is recorded at $6.49.
Based on the current market analysis, the LINK/USD price is moving below the Moving Average price, indicating a bearish trend in the market. The trend in the market has shown bearish tendencies over the past few hours, further supporting this observation. Additionally, there has been a negative movement in the market, resulting in a decrease in the value of ChainLink and strengthening the bearish control in the market.

Chainlink price analysis shows the Relative Strength Index (RSI) to be 44, signifying a stable cryptocurrency. The current analysis suggests that the LINK cryptocurrency is currently positioned in the lower-neutral region of the market. Additionally, the Relative Strength Index (RSI) trend indicates a shift toward a downward movement, which is often indicative of a bearish market. The decrease in the RSI score is further evidence of dominant selling activities within the market.
ChainLink Price Analysis Conclusion
Based on the Chainlink price analysis, it is evident that the cryptocurrency is currently following a declining trend, indicating that there is much potential for activity on the negative extreme. Furthermore, the current condition of the market seems to be indicating a declining approach, suggesting that there is a possibility for further downward movement in the future.


