The Chainlink price analysis reveals LINK/USD has finally found support after going through a severe correction. The price is recovering today after being on the decline for the last three days in line. The bullish momentum has helped prevent further price sinkage, as the price has slightly recovered to $7.14. Resistance for LINK/USD is present at $7.36, followed by another resistance at $7.59; in contrast, a much stronger support is present at $6.94 after $7.07.
LINK/USD 1-day price chart: LINK recovers at snail’s speed
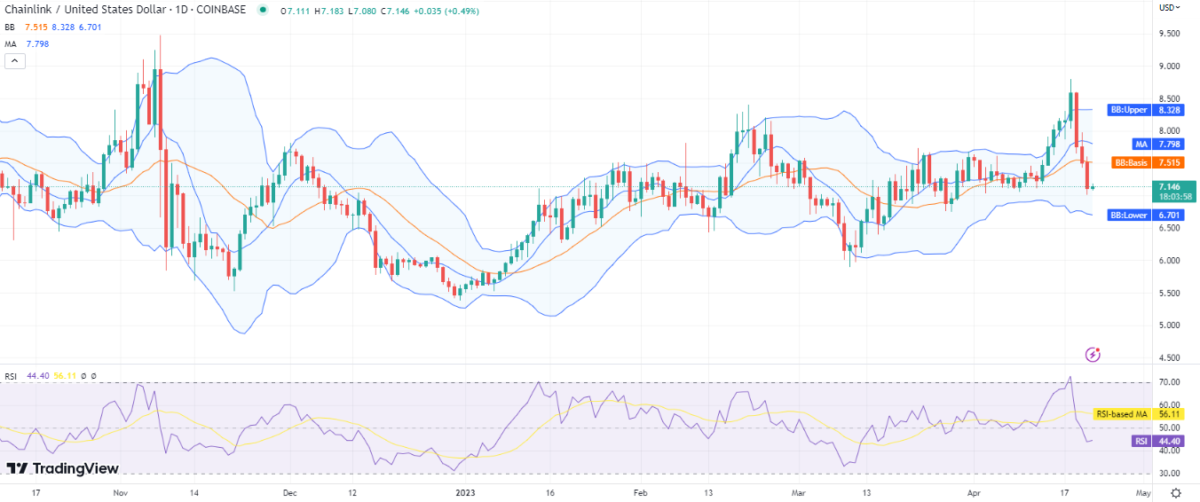
The 1-day price chart for Chainlink price analysis shows an increase in price. The LINK/USD is trading hands at $7.14 at the time of writing. The crypto pair is still at a loss of 4.56 percent over the last 24 hours and a loss of 6.80 percent over the course of the last seven days, as the trend has been bearish since April 19, 2023. The trading volume is down by more than 11 percent, providing a market dominance of 0.32 percent.

The volatility for LINK/USD is on the higher side, as the Bollinger bands are expanded, indicating higher fluctuations in price value. As can be seen on the 1-day chart, the price devaluation was quite at a high pace, but in contrast, today’s price increment is small. However, the upper Bollinger band is present at the $8.32 mark, representing resistance for LINK/USD, and the lower band is present at the $6.70 mark, representing the lowest support for LINK/USD.
The relative strength index (RSI) is in the lower half of the neutral zone at index 44 but on a very slight upward slope. The indicator shows a very slow progression in buying activity, but buying may increase over time.
Chainlink price analysis: Recent developments and further technical indications
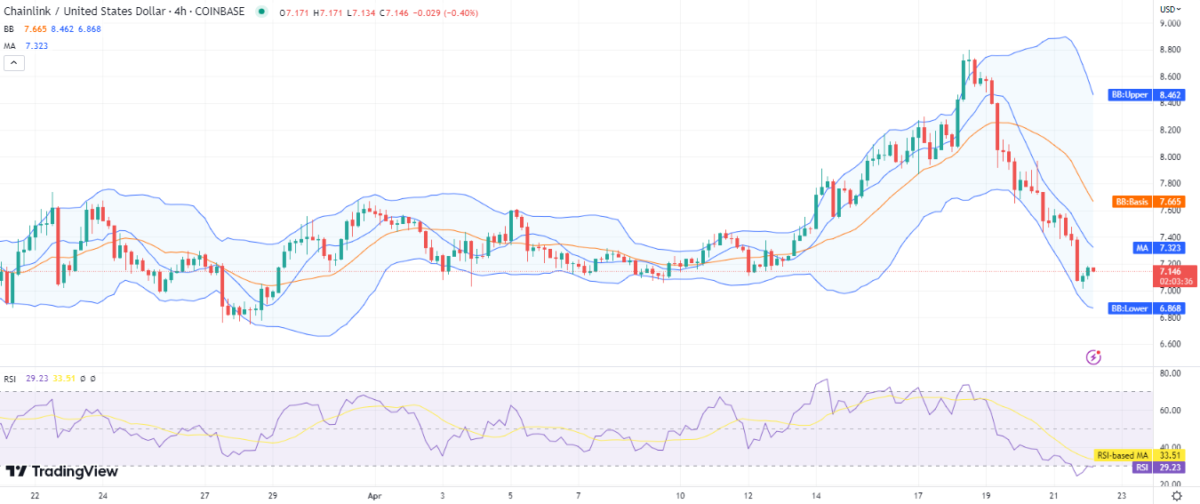
The 4-hour Chainlink price analysis shows bulls have countered the bearish attack and are trying to restore their momentum, as, after a steep decline for three consecutive days, the price function is again on an up move. However, selling pressure still persists in the market as the price has slowly corrected again.

The volatility is also decreasing on the 4-hour chart as the Bollinger bands are steeply converging, but they are still far apart. The upper band has come down to $8.46, and the lower band is at the $6.86 mark, making an average of $7.66. The average of the Bollinger bands is above the price level, indicating resistance for the LINK/USD pair. The RSI is at index 29 in the underbought zone, and its curve is again flattening out, showing an inclination towards the selling side.
Chainlink price analysis: Conclusion
The Chainlink price analysis suggests that the price movement will be comparatively less in the coming days as volatility decreases for the LINK/USD price function, but as the volatility is high at this time, the price recovery may get some pace in the next trading session. However, for today, the price is expected to float below $7.30.


