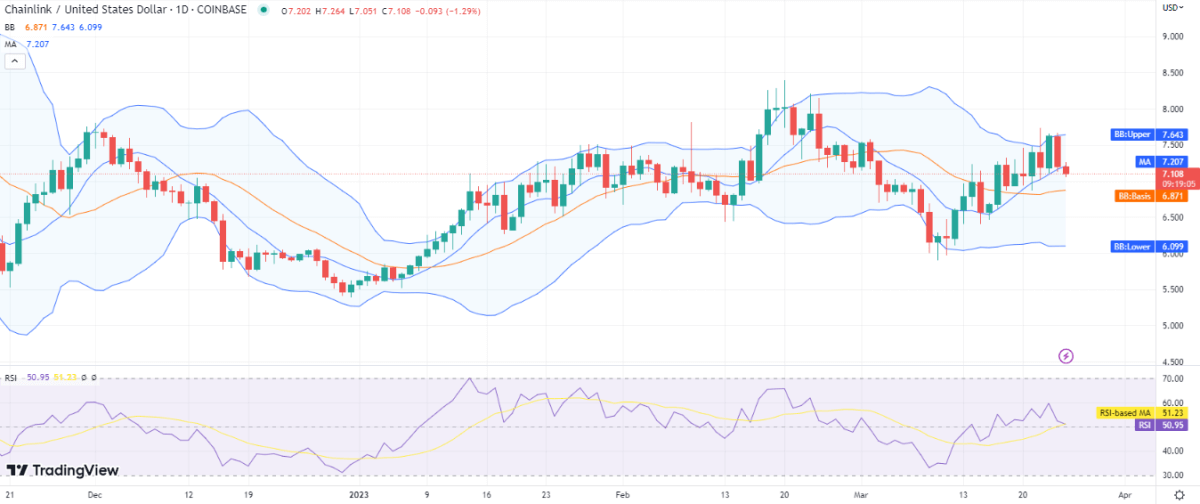
More selling action has been observed, and this is reflected in the most recent Chainlink price analysis, which shows bearish indications for the day. After its previous high on March 23, 2023, at $7.62, the price has been in a bearish trough since yesterday. Prior to that, the bullish trend was quite powerful, and the trend line was upward, but yesterday’s significant correction changed the trend, and today the bears are once again in control. A bearish price movement is indicated by the red candlesticks on the price chart, and the LINK/USD value has fallen to a low of $7.10.
LINK/USD 1-day price chart: Given the price’s 3.49 percent decline, bears are still in the lead
As the bears have successfully attempted to maintain their advantage over the past 24 hours, the 1-day Chainlink price analysis is showing a decreasing trend for the day. The LINK/USD value is now $7.10 after dropping 3.49 percent over the previous 24 hours, and the red candlestick is a sign of increasing bearish momentum. If the bearish attempts continue, further declines may also occur in the upcoming days. The cryptocurrency’s moving average (MA) value is currently $7.20 higher than the current price level, supporting the bearish pattern.

The Bollinger bands are now diverging over a larger region, which is a reflection of the increased volatility. The higher value for the day is $7.64, and the lower value is $6.09. These values are determined by the Bollinger Bands Indicator. The relative Strength Index (RSI) score is fairly neutral and has dropped to index 50, but the indicator’s downward-sloping curve suggests that there are also bearish components present at the current price level.
Chainlink price analysis: Recent developments and further technical indications
The price has been falling for the past few hours, according to the 4-hour Chainlink price analysis, which also reveals that the total power of balance is leaning more to the downside. Although the price breakout at the beginning of the trading session was positive, the bears ultimately still controlled the price function for the day as the price later began to fall. Near the bottom bound of the Bollinger bands, the price has decreased to the $7.10 level. Despite the bearish tendency, the price deficit today is not significant, and the RSI curve also suggests that some support may materialize in the hours to come.

The upper Bollinger band value at $7.69 represents opposition on the 4-hour chart, while the lower Bollinger band value at $6.96 represents support. This indicates a high level of volatility. The MA is currently trending at $7.24 above the current price level.
Chainlink price analysis conclusion
The Chainlink price analysis reveals that the price chart has been dominated by bears for today, but the RSI curve also suggests that there might be some kind of support close to the present price level. Despite the current bearish trend, the loss is still not severe. If the coin’s support materialized, the trend may change in the following trading session, and if bears acquired momentum, a further decline in the price level is also possible.


