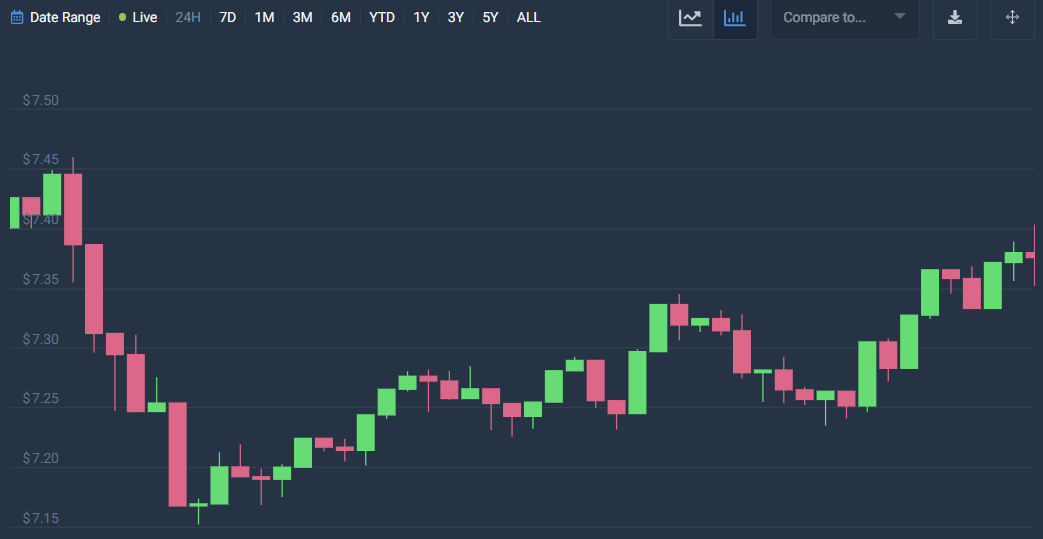
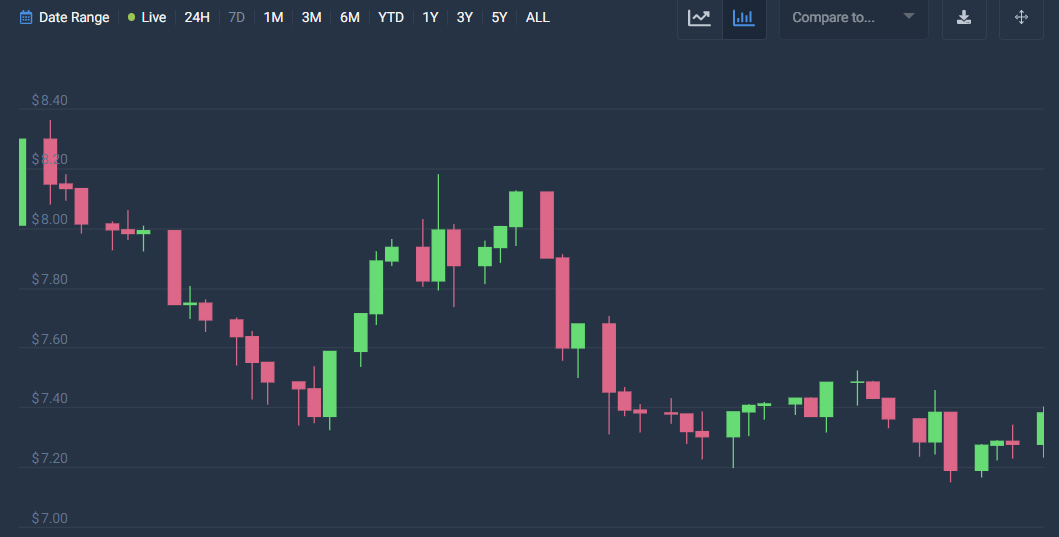
ChainLink price analysis for February 28, 2023, reveals the market is in a negative trend and is moving downhill with momentum, which is bad news for the LINK market. For the previous several hours, ChainLink’s price has stayed negative. From $7.5, the price dropped to $7.1 on February 27, 2023. Yet soon after, the market saw an increase in value and gained some worth. In addition, ChainLink rose and now trades at $7.3, just shy of $7.5.
The current price of Chainlink is $7.38, and it has a market worth of $3.75 billion, a 24-hour trading volume of $690.60 million, and a market dominance of 0.35%. LINK’s price dropped by 0.21% over the previous day.
Chainlink’s all-time high price, which was $52.89 on May 10, 2021, was reached at that time, while its all-time low price, which was $0.126297 on September 23, 2017, was reached then. Since its ATH, the price has dropped to $5.36. From the last cycle low, the highest LINK price was $9.45. The Fear & Greed Index is now at 53 (Neutral), while the Chainlink price forecast sentiment is bearish.
Out of a maximum supply of 1.00B LINK, 508.00M LINK are now in circulation. At an annual supply inflation rate of 8.78%, 40.99M LINK were produced in the previous year. Chainlink is currently ranked #4 in the DeFi Coins category and #7 in the Ethereum (ERC20) Tokens sector in terms of market capitalization.
LINK/USD 1-day price analysis: Latest developments
ChainLink price analysis reveals the market’s volatility following an increasing movement. This means that the price of ChainLink is becoming more prone to movement toward either extreme, showing volatile dynamics. The open price is $7.39, and it seems like the high price will be $7.40. The close price is at $7.41, while the low price is still at $7.36. The ChainLink market has changed by 0.25%.
The price of the Moving Average looks to be trending lower than the price of the LINK/USD, indicating a bearish swing. The bears appear to be driving the market’s movement. Moreover, the LINK/USD price looks to be rising, indicating a positive market. The price is predicted to increase above $7.5 by the end of this week due to the market’s apparent uphill potential.

ChainLink price analysis reveals that the Relative Strength Index (RSI) is 51 showing a stable cryptocurrency market. ChainLink is thus located in the central neutral area. The RSI also seems to be moving upward, which denotes an increasing movement. The RSI score inclines when buying activity predominates.
ChainLink price analysis for 7-days
ChainLink price analysis reveals the market’s volatility following a decreasing movement, indicating that the price is becoming less likely to fluctuate between the two extremes. The high price is seen at $7.41, while the opening price seems to be $7.28. The low price, on the other hand, is at $7.24 and has changed by 1.69%, closing at $7.40.
The price of the Moving Average looks to be going above the price of the LINK/USD, indicating a bullish advance. The market’s trajectory, however, appears to have exhibited negative tendencies during the past several hours. Also, the market has chosen to go in a negative direction, which will lower its value and bolster the bearish market control.

Chainlink price analysis shows the Relative Strength Index (RSI) to be 49, signifying a stable cryptocurrency. This indicates that the central neutral zone is where the LINK cryptocurrency is located. Also, it appears that the RSI course has changed to the downside. The RSI score’s decrease also indicates a predominant selling trend.
ChainLink Price Analysis Conclusion
Chainlink price analysis reveals that the cryptocurrency follows a declining trend with much room for activity on the negative extreme. Also, it indicates that the market is now on a downward trend and has the ability to continue doing so.


