Chainlink price analysis reveals that the market is following an uptrend after a recent bullish stream. The market has broken out of a descending triangle pattern and is now hovering around the $7.23 level. This marks a significant gain from its previous support at $6.85, and if the current momentum continues, we could potentially see prices reach $7.25 or higher. The market is facing strong resistance at the $7.30 level. If the bulls can break through this resistance, we could see prices surge even higher. On the other hand, if the bears take control of the market and push it below $6.85, we could see prices dip to $7.20 or lower.
Chainlink price analysis 1-day chart: Bullish strives to breach the $7.30 resistance level
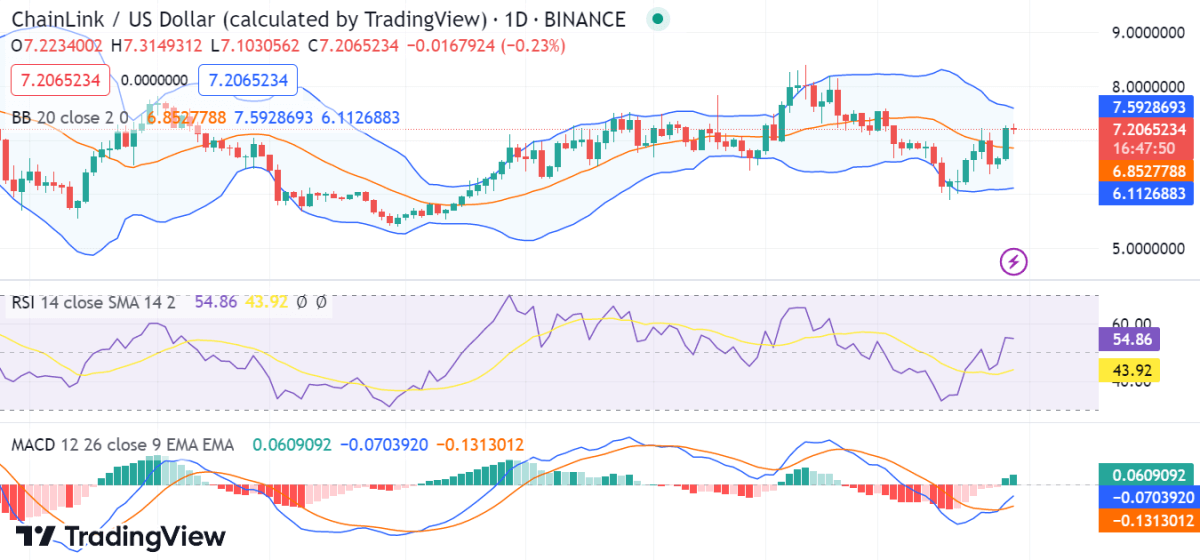
The 1-day Chainlink price analysis shows that the market is trading in an uptrend and looks ready to make new highs. The digital asset has increased by 5.29 percent in the past 24 hours and is currently trading at $7.23. The total market capitalization of the LINK/USD pair is over $3.73 billion, and the 24-hour volume is now over $385 million.

The daily technical chart shows that Chainlink has formed a bullish pennant pattern, and the moving average convergence and divergence (MACD) line is bullish. The Relative Strength Index (RSI) is also indicating an overbought market, which could signal a potential pullback in the near term. The volatility is low as the Bollinger bands have narrowed, which is an indication of low price fluctuations. The upper value of the Bollinger Bands indicator is now at $7.592, while the lower value is at $6.112 on 24-hour charts.
LINK/USD 4-hour price chart: Bullish momentum recovers price up to $7.23
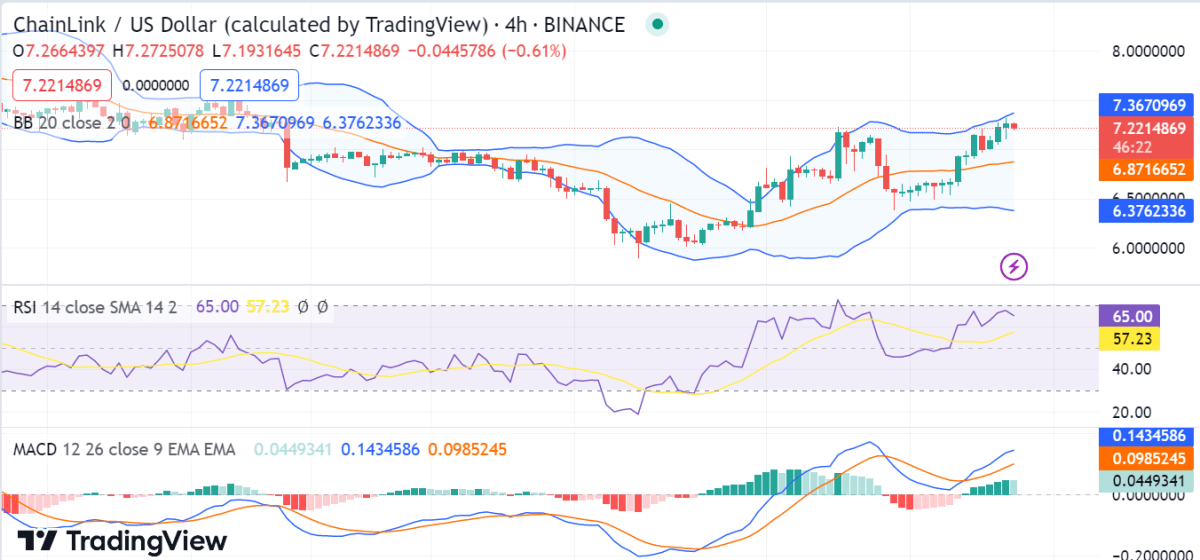
Looking at the hourly Chainlink price analysis indicates that the market is trading in an uptrend, and prices could continue to rise if the bulls remain in control. With the current bullish sentiment, we could potentially see Chainlink break out of the $7.30 resistance and reach new highs in the upcoming days. Over the last four hours, the prices haven’t made any significant moves. The bulls have upheld the prices well above the $7.23 level and are likely to push the prices higher.

The volatility is also increasing, which is an encouraging sign for buyers regarding the upcoming price trends. Similarly, the upper edge of the Bollinger bands indicator now rests at $7.367, representing the resistance, while its lower edge settles at $6.376, representing the strongest support. At the same time, the Bollinger Bands indicator displays an average of $6.871. Moreover, the MACD line has recently crossed above the signal line, and the RSI is currently hovering in the overbought zone.
Chainlink price analysis conclusion
In conclusion, Chainlink’s price analysis suggests that the market is currently in a bullish phase as prices have surged above the $7.23 level. The volatility is also increasing, which means that there are more chances for sudden price movements. However, it is essential to keep an eye on the technical indicators before making any further decisions regarding the prices of this digital asset.


