The Chainlink price analysis is indicating positive developments for buyers as bulls have been successful in regaining support. Prices are gradually increasing, and it won’t be long before they surpass their present level, which is $6.91. The resistance level of $6.99 is still quite a distance from the present price value; if the bullish momentum increases over the course of the next 24 hours, it may even be exceeded.
LINK/USD 1-day price chart: Price rises after bullish comeback
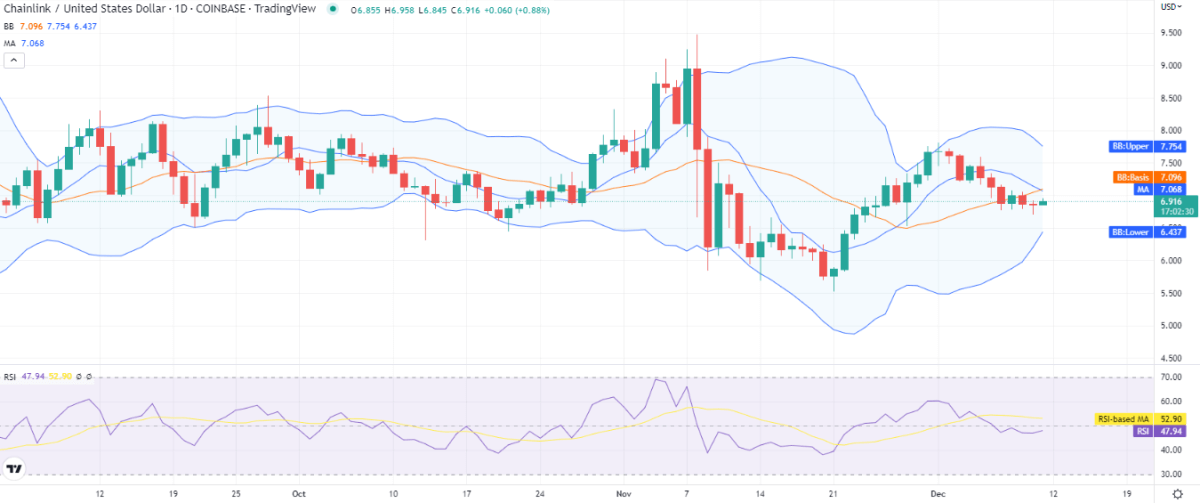
According to the most recent updates, the 1-day price chart for Chainlink price analysis shows that cryptocurrency value is increasing today. The chart indicates that the bulls have made attempts to make a comeback, and today the bulls have been successful in regaining control.
According to Chainlink’s pricing study, the price levels are rising and have reached $6.91 today. The Moving Average (MA), which is essentially the average of all price values, is currently at $7.06, or slightly more than the current price. The coin’s value increased 1.26 percent during the past 24 hours, while it has lost 5.97 percent over the previous 7 days.

The Bollinger bands are narrowing down as the volatility is supposedly decreasing, the upper band has reached $7.75, and the lower band has reached the value of $6.43. The upper and lower limits of the volatility indicator represent the resistance and support levels for the crypto pair. The Relative Strength Index ( RSI ) score is on the increasing side as well and has slightly increased to index 47 in the 1-day price chart.
LINK/USD 4-hour chart: Recent developments and further technical indications
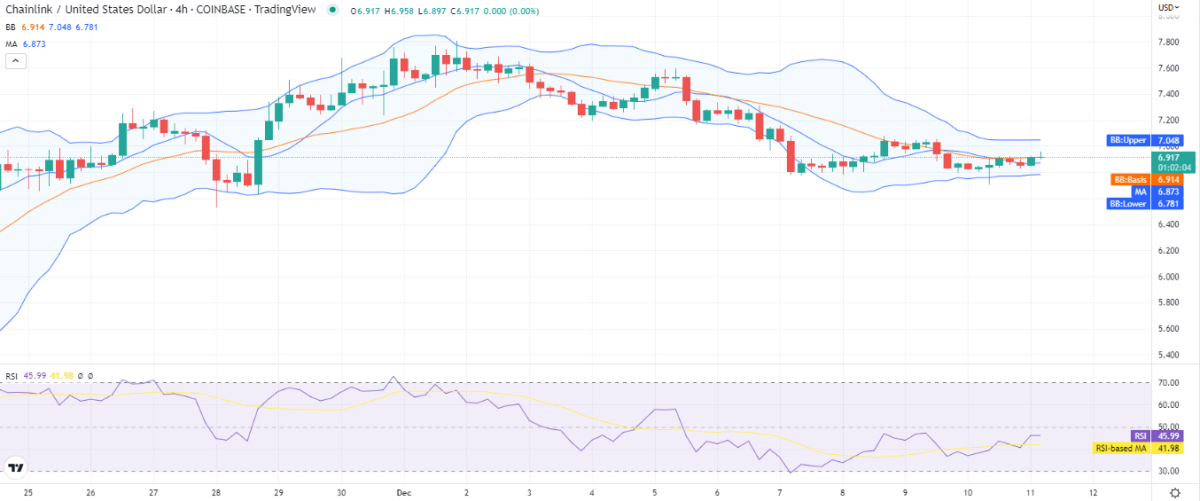
As the bullish trend resumes, the 4-hour Chainlink price analysis likewise predicts a price increase. More green candlesticks are appearing on the chart during the last few hours, which has been quite good for the bulls. The price fluctuation has, however, slowed considerably.

The price has increased up to $6.91, which is barely above the chart’s moving average value of $6.87. The low level of volatility is a generally a supportive indication for cryptocurrency.
The Bollinger bands, which are crucial for predicting the direction of cryptocurrencies, are currently displaying values of $7.04 for the top band and $6.78 for the bottom band. The RSI score has also increased, but now, the indicator is hovering horizontally at index 45, which is far better than the score of the previous days.
Chainlink price analysis conclusion
A increase in price levels is predicted by the aforementioned 1-day and 4-hour Chainlink price analysis; as of today, the market has also been in favor of the bulls. The price has successfully surged past $6.90 after gradually regaining pace.
If the pressure from the buyers’ side increases, there is a real chance that the bulls may regain the advantage. However, the price oscillation is beginning to be affected by the resistance at $6.99, thus the likelihood of advancement may be minimal.


