Dogecoin price analysis indicates the resuming of a bearish trend following a brief period of sideways movement over the previous few days. The downturn that began last week has continued as the price has dropped up to $0.085162. However, the bulls are maintaining control of the short-term moving line, indicating that they still have a chance to hold the top spot. The DOGE/USD pair has a trading volume of around $442 million and a market capitalization of $11.2 billion. The cryptocurrency is ranking eighth in the larger cryptocurrency market
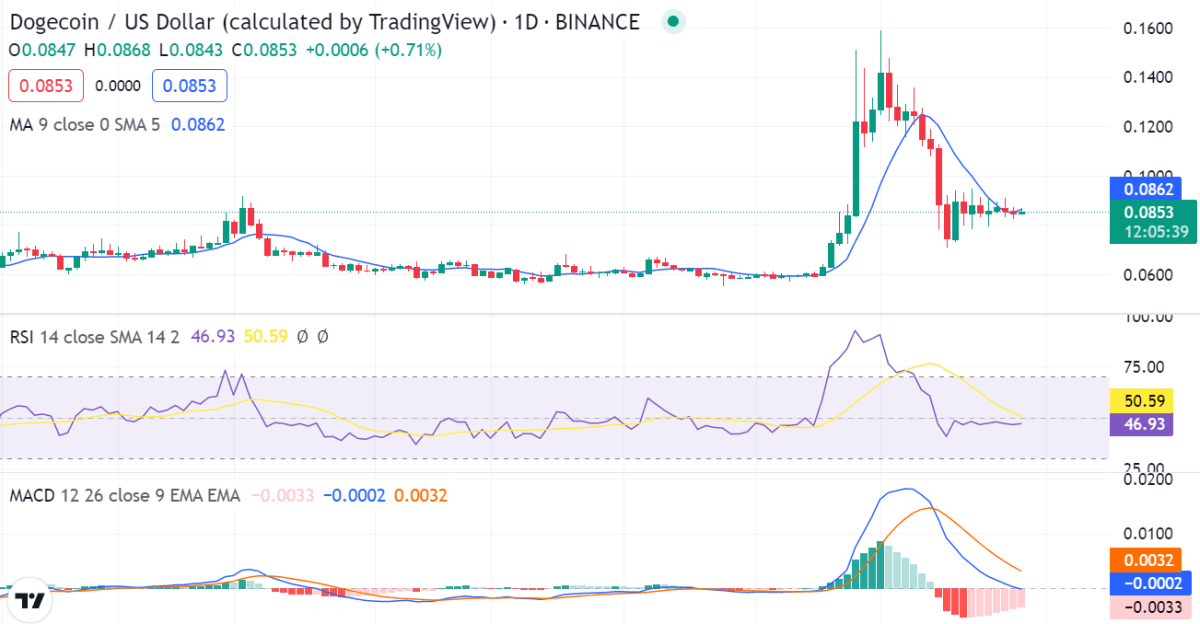
DOGE/USD 1-Day price chart: Bears pulling the price below $0.0865 resistance level
The 24-hour Dogecoin price analysis shows that the market is now under the influence of bears, driving the price down to 0.0853. If the support level of $0.0831 is breached, DOGE is projected to continue on its downward trajectory throughout the day. However, if the resistance level of $0.0865 is not crossed, it may indicate a reversal in the price action.

The relative strength index is moving sideways and is currently at 50.59 which shows that the bulls and bears are competing for the top position. Meanwhile, the moving average convergence divergence (MACD) curve also currently sits above the neutral zone and forms lower highs. The MACD line (blue) is however below the signal line (red) indicating a bearish market. Price also keeps just below the 9 and 21-day moving averages, along with the crucial 50-day exponential moving average (EMA) at $0.0881.
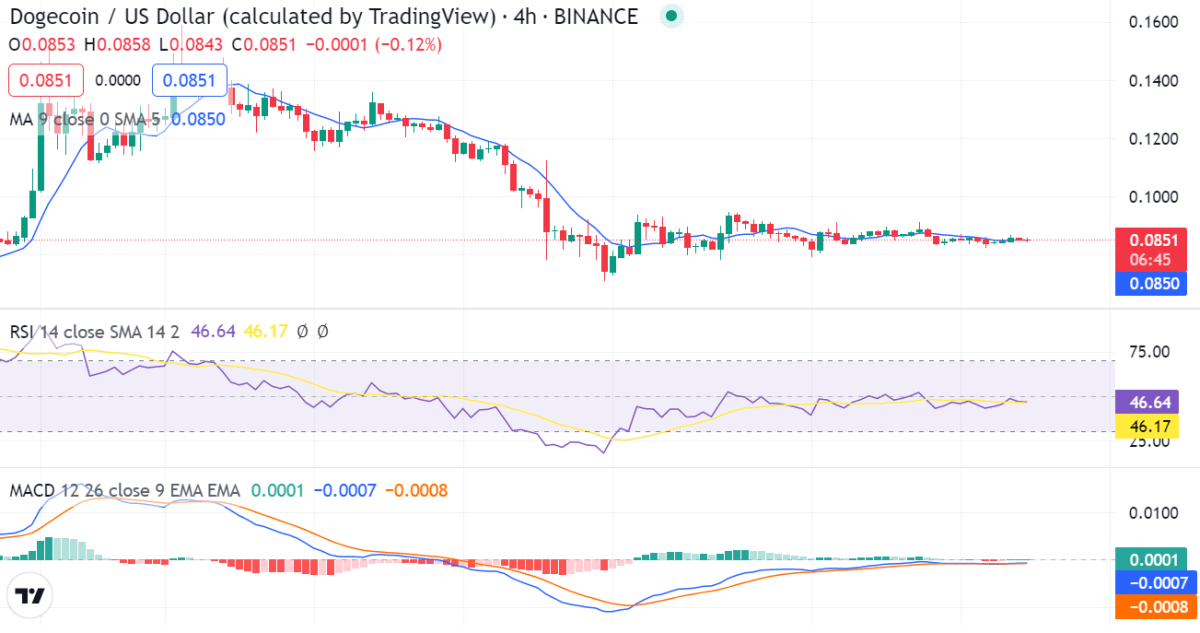
DOGE/USD 4-hour price chart: Bulls are moving toward the support
The 4-hour Dogecoin price analysis is showing bullish signs as the price has gone up to reach the $0.0854 level. The RSI indicator has been on a slight uptrend for the last few hours and has now reached an index of 46.17 it may push northward in the upcoming trading hours to touch overbought levels.

The 4-hour Moving average (MA) is concurrently upgrading with the price at $0.0855, indicating that a bullish trend might emerge in the near future. The MACD chart for ADA/USD shows a sideways movement, as the signal line and the MACD line coincide.
Dogecoin price analysis conclusion
Overall, the Dogecoin price analysis reveals that the market is experiencing average selling pressure, which is being fueled by negative momentum. But it’s still unclear if this decline will last or whether there will be a positive turnaround at this time. In any event, it’s essential to exercise caution and keep a close eye on market trends in order to make wise investing selections.
Disclaimer. The information provided is not trading advice. Cryptopolitan.com holds no liability for any investments made based on the information provided on this page. We strongly recommend independent research and/or consultation with a qualified professional before making any investment decisions.


