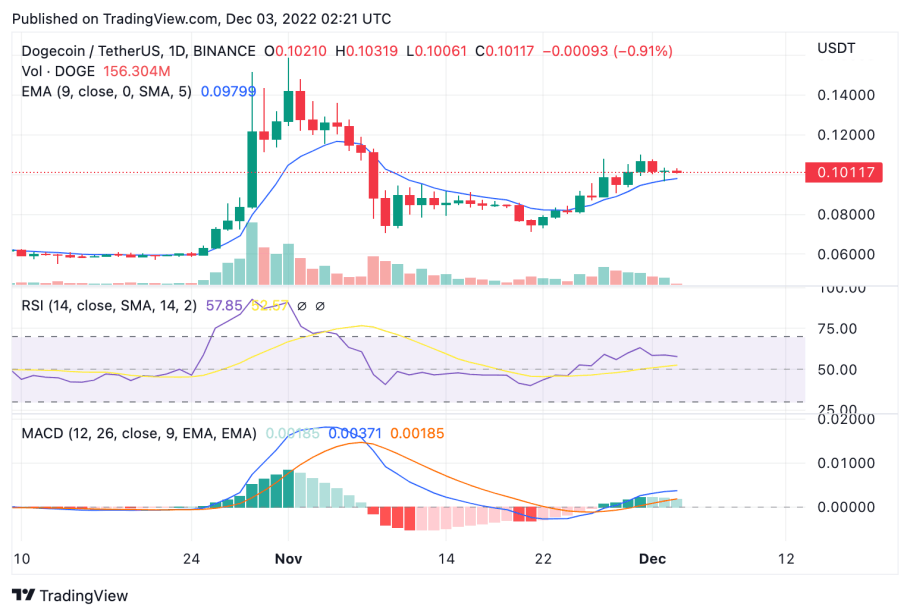
Dogecoin price analysis shows a continued increment to follow up on the 12 percent weekly rise, as price settled over the $0.101 mark over the day’s trade. After continual rise since November 21, the meme cryptocurrency seems to have settled around the current price mark, and could be set for a minor correction over the coming 24 hours. Market capitalisation over the day’s trade rose closer to $13.5 billion, while trading volume dropped 5 percent to just above $700 million.
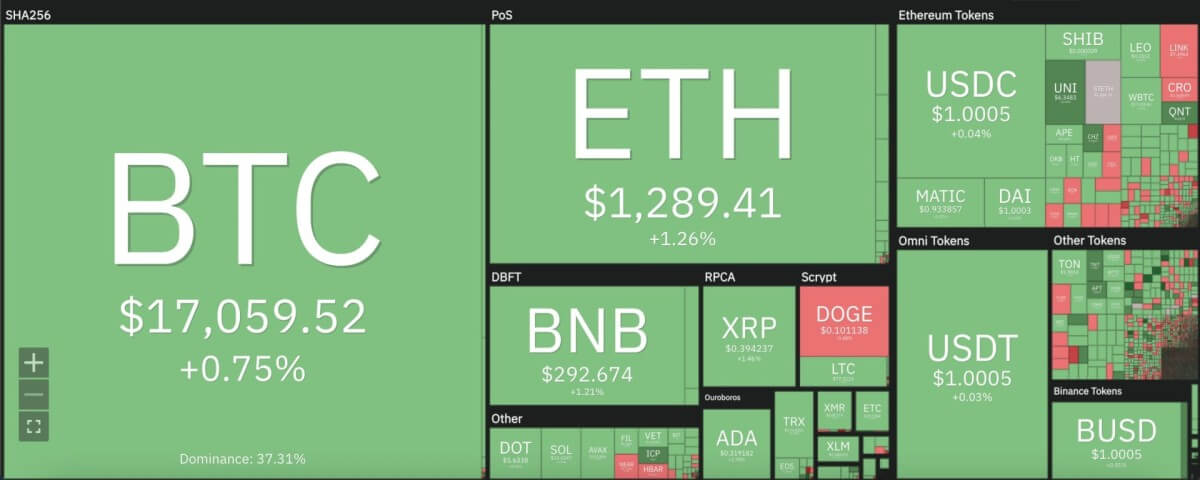
The larger cryptocurrency market showed greens across the board over the past 24 hours, led by Bitcoin’s upturn to move above $17,000. Ethereum moved up to $1,300 with a 2 percent increment, whereas leading Altcoins showed similar turnouts. Ripple also rose 2 percent to reach $0.39, similar to Cardano’s rise up to $0.32. Meanwhile, Solana settled around $13.62, and Polkadot rose 4 percent to $5.63.

Dogecoin price analysis: RSI approaches overbought zone on the daily chart
On the 24-hour candlestick chart for Dogecoin price analysis, price can be seen falling into a horizontal pattern after upping for consecutive trading sessions over the week. While support sits around $0.09, DOGE bulls will be expected to push above the current price of $0.101 up to the $0.18 resistance. The recent increment meant the DOGE price peaked past the 9 and 21-day moving averages, along with the 50-day exponential moving average (EMA) at $0.098.

The 24-hour relative strength index (RSI) has moved up into the overbought zone just below the 60 mark and faces a sideways trend over the past 2 days. This could indicate a potential point of correction for Dogecoin price if bulls fail to hold above $0.09 support. Meanwhile, the moving average convergence divergence (MACD) curve shows a bullish divergence cotinuing to be in place above the neutral zone, to indicate the potential bullish momentum.
Disclaimer. The information provided is not trading advice. Cryptopolitan.com holds no liability for any investments made based on the information provided on this page. We strongly recommend independent research and/or consultation with a qualified professional before making any investment decisions.


