Dogecoin price analysis is in the bearish territory as the price falls for the second day in a row. The most recent low was seen at $0.07057, substantially lower than yesterday’s high of $0.07313. The sell-off appears to be driven by speculation that demand for Dogecoin is decreasing due to its limited use cases and lack of blockchain development.
Looking ahead, DOGE/USD needs to break above the $0.07313 resistance for a trend reversal to become more likely. In terms of downside support, DOGE/USD has found strong support at $0.06814. A break below this level could spark even more selling pressure and push the price further down.
The market capitalization for the digital asset stands at $9.3 billion, according to CoinMarketCap data. Dogecoin’s 24-hour trading volume is $446 million.
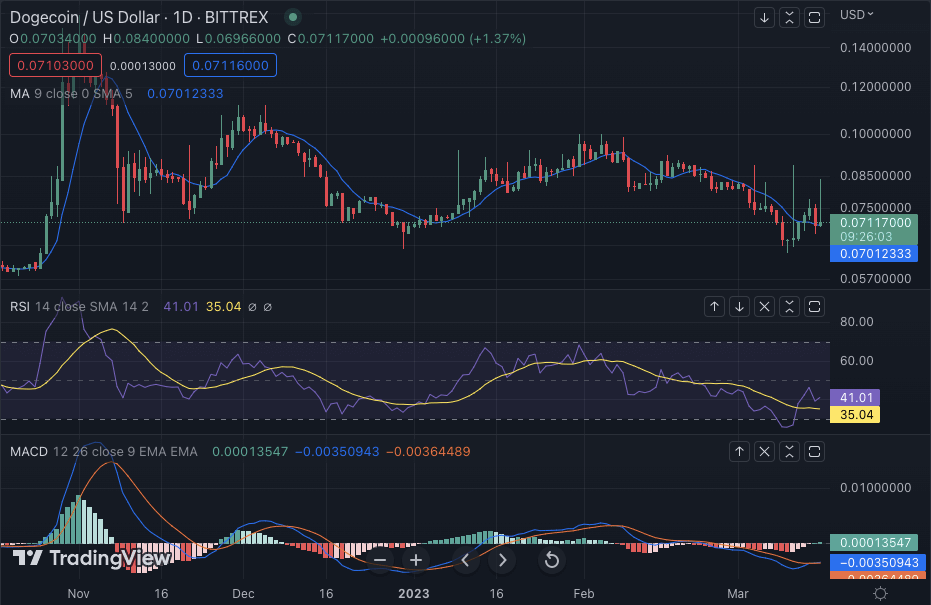
Dogecoin price analysis 1-day price chart: DOGE tumbles to 0.07057 after the bearish turn
The 1-day price chart for Dogecoin price analysis shows the downward price movement of DOGE. Although the coin gained significant value during the previous days, today, some damaged damage has been noted in the coin’s value as bears are at lead. DOGE is trading hands at $0.07057 at the time of writing. The price is nearing the support zone, which may come under test if the selling pressure continues.

Talking of the moving average (MA), its value is present below the price level at the $48.2 mark. Meanwhile, the MACD is into its bearish crossover, as it has been moving downward since yesterday. Moreover, the RSI indicator is below 40 levels, which indicates that selling pressure is still strong in the market for DOGE/USD.
Dogecoin price analysis: Recent developments and further technical indications
The 4-hour price chart for the Dogecoin price analysis shows the price breakout was downwards today, and the price is still on a decreasing trend. Bulls haven’t shown up yet, and the bearish activity has been going on during the last four hours as well, as the price decreased to $0.06940, bringing the total loss to 3.63 percent.

The MA is trading below the price level on the 4-hour chart as it is present at $50.5, below the current price level. The moving average converges divergence (MACD) is in the bearish crossover as it has been moving downwards for the past few hours. The MACD line has crossed the signal line, and this is a bearish indicator. The relative strength index (RSI) is currently at 42.2 levels, which suggests that the selling pressure is still strong in the market for DOGE/USD.
Dogecoin price analysis conclusion
Overall, the Dogecoin price analysis continues to be bearish in the short term, and traders should watch out for any signs of a possible trend reversal. The key support levels and resistance levels need to be closely monitored, and if the price breaks above $0.07313, it could signal a trend reversal. On the downside, DOGE/USD needs to hold at $0.06814 for any potential upside move to take place.


