Dogecoin price analysis for December 11, 2022, reveals the market is following an upward movement, showing increasing momentum, signifying positivity for the DOGE market. The price of Dogecoin has remained bullish over the past few hours with a support of $0.09626 and resistance for DOGE/USD pair is currently at $0.09736. The current price of Dogecoin is $0.09694, with a trading volume of $215,201,740. Dogecoin has increased by 0.22% in the last 24 hours. Dogecoin currently ranks at #8 with a live market cap of $12,860,762,624.
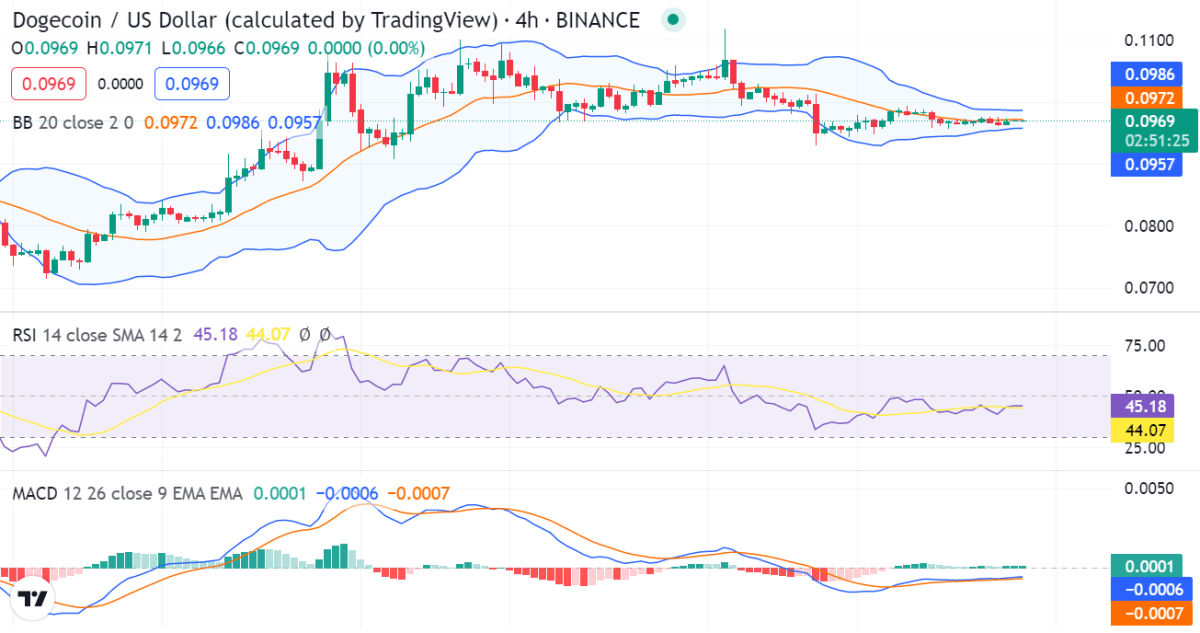
DOGE/USD 4-hour price chart: Latest developments
The 4-hour Dogecoin price analysis reveals the market’s volatility following an increasing movement, which means that the price of DOGE is becoming more susceptible to experiencing variable change on either extreme. The Bollinger band’s upper limit is $0.0986, serving as DOGE’s strongest resistance point. Conversely, the lower limit of Bollinger’s band is $0.0957, which is the strongest support point for DOGE.

The Relative Strength Index (RSI) is currently at 44.07, signifying that the market is overbought and that the bulls are still in control of the market. DOGE’s price appears to be moving over the price; the MACD (blue) line is above the signal (red) line, which signifies a bullish movement. The market’s trend seems to be dominated by bulls. Moreover, the DOGE/USD price appears to be moving upward, illustrating a further increasing market. The market appears to be showing bullish potential.
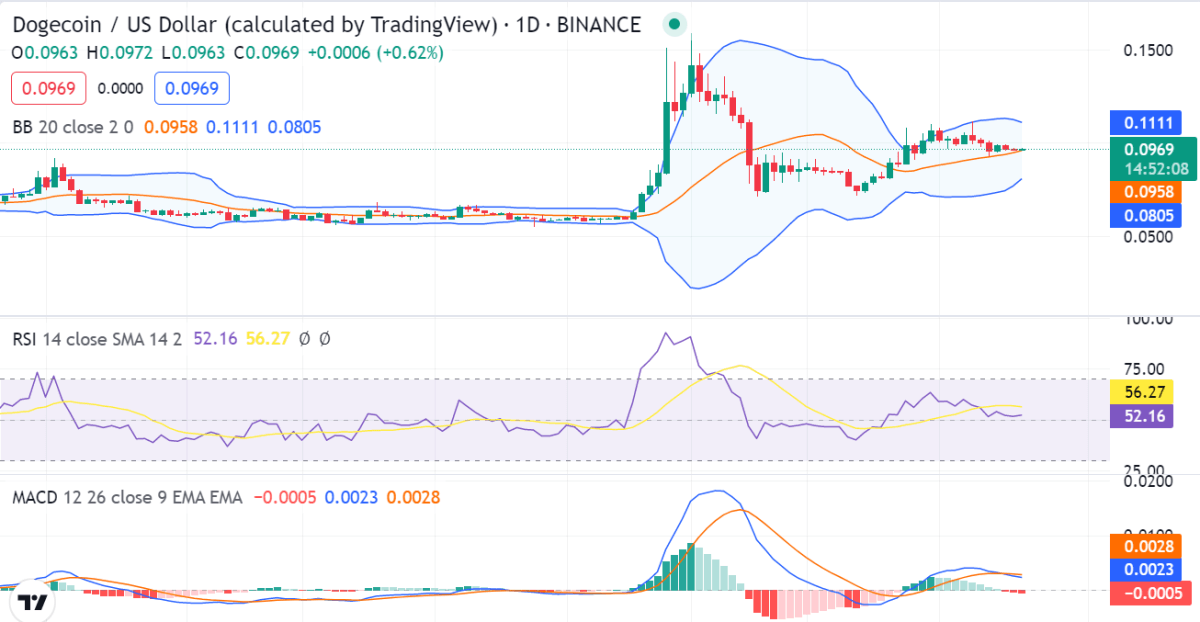
DOGE/USD 1-day price chart: Strong bullish feeling develops
The 1-day Dogecoin price analysis displays the market’s turbulence after an upward rise, indicating that Dogecoin’s price is becoming more susceptible to changeable shifts on either extreme. The Bollinger’s band’s upper limit is $0.111, serving as DOGE’s strongest resistance point. Conversely, the lower limit of Bollinger’s band is $0.0805, which is the strongest support point for DOGE.

The histogram’s green tint represents the MACD’s current positive sentiment. The indicator, however, exhibits weak bullish momentum, as evidenced by the histogram’s modest height. Additionally, the histogram’s lighter shade denotes a waning bullish momentum and shows that the purchasing pressure has subsided. The Relative Strength Index (RSI) has been trading at 56.27, which indicates that the market is neither overbought nor oversold.
Dogecoin price analysis conclusion
To conclude the Dogecoin price analysis, the analysis shows that there is considerably more room for action on the positive extreme as the cryptocurrency pursues an upward trend. Additionally, it appears like the market is moving in a positive direction right now since it has the ability to reach a bullish extreme.
Disclaimer. The information provided is not trading advice. Cryptopolitan.com holds no liability for any investments made based on the information provided on this page. We strongly recommend independent research and/or consultation with a qualified professional before making any investment decisions


