The current market patterns are noticeably changing, according to Dogecoin price analysis. According to today’s report, the price value hit a new low of $0.087 after falling for some time. Since the trend line after 04 December 2022 is downward, the weekly trend also indicates that bears are in the lead. As the support is still below at the $0.085 level, it is also possible to forecast that the price levels will keep falling.
Dogecoin price analysis: DOGE loses nearly 10 percent as price levels sink
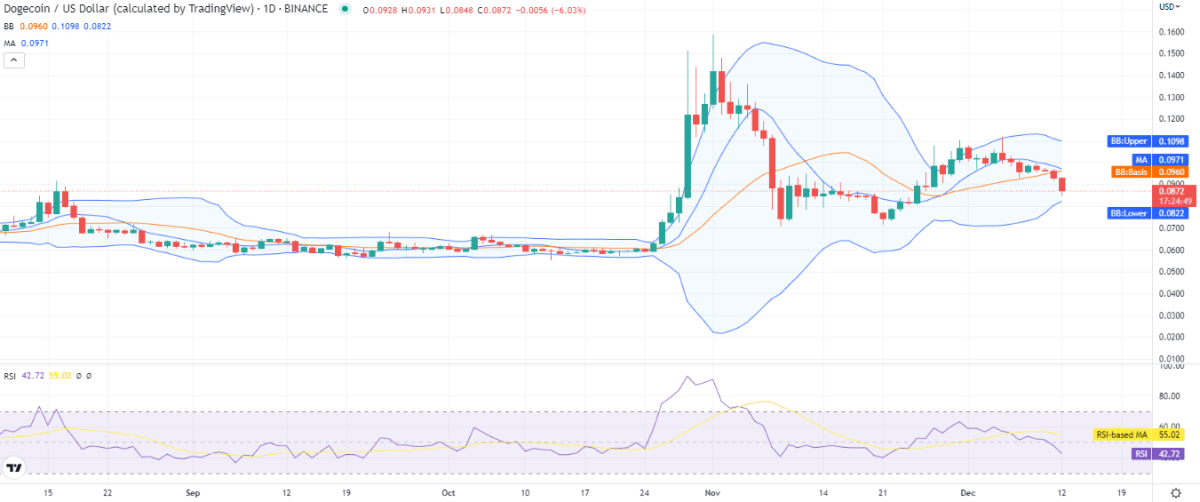
Given that the price function was already under negative pressure, the one-day Dogecoin price analysis saw a sharp decline in price today. The price of the cryptocurrency has dropped to $0.087 today after failing to stave off bearish pressure. The value of the cryptocurrency has decreased by 9.99 percent over the past 24 hours and by 16.24 percent over the last 7 days.

The moving average (MA) shows us the average value as calculated at $0.097, which is higher than the current price. The past week has seen more damage; this resulted in a low Relative Strength Index (RSI) score of 42 as well. The downward curve of the indicators hints at the selling activity in the market.
As the past week has experienced a bearish trend, the volatility is also decreasing as the Bollinger bands converge. The upper band has reached the level of $0.109, representing the highest resistance, while the lower one simultaneously reached $0.082, representing the strongest support.
DOGE/USD 4-hours chart: Recent developments and further technical indications
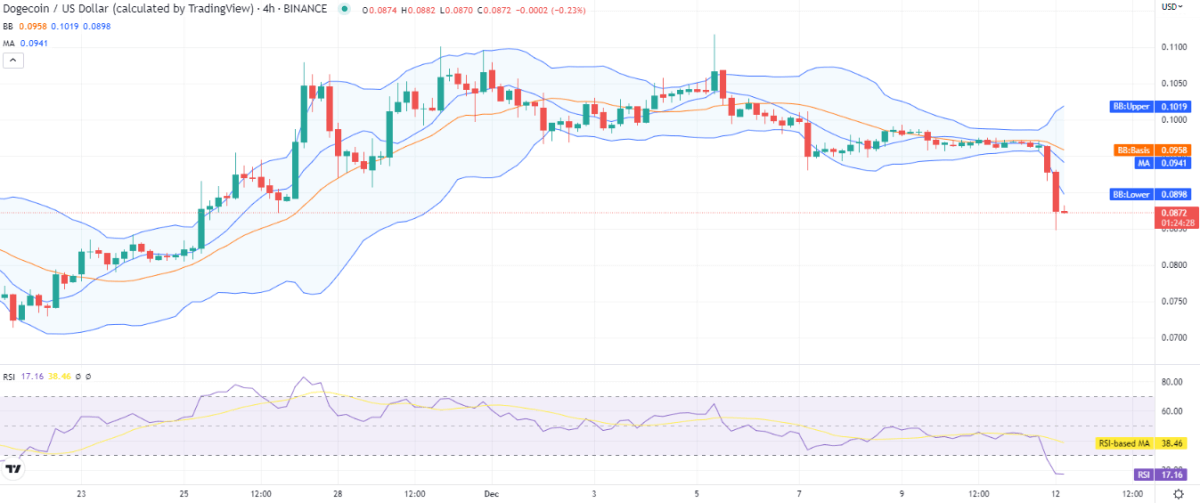
The 4-hour Dogecoin price analysis reports show a major decline in the coin value to $0.087. There has been constant selling pressure in the market today as the price levels kept sinking. The Bollinger bands average is showing a $0.096 value, with increasing volatility. Also, we can see that at the end, SMA 50 and SMA 20 both have taken a downward turn, which is a major bearish indicator.

The increase in volatility is due to the quick price sinking rate, as the upper band went to $0.101 and the lower one to $0.089. The moving average, on the other hand, shows us the collective average of $0.097 in the candlestick chart. As a greater number of red candlesticks emerged today, the RSI score has lowered into the undersold zone at index 17.
Dogecoin price analysis conclusion
The Dogecoin price analysis informs that the past week has been crucial for the cryptocurrency. The charts show that the short-term trend line has been moving downward. The coin is currently undervalued, as indicated by the RSI score of 17, which is bad news for buyers. However, the $0.085 level might provide support for DOGE/USD.


