Dogecoin price analysis is moving on negative terms as bears have taken over the control of the crypto. At press time, DOGE is trading at $0.08115 after hitting the low of $0.07906 today. Crypto has been dropping since yesterday, and the trend is likely to continue with no signs of recovery in sight.
The market opened today’s trading session below $0.081 and soon saw a bearish wave taking over the market as it dropped to the low of $0.07906 within minutes. The crypto has been trading in between these two levels since then and is likely to see further losses if the bears keep their grip on the Dogecoin price analysis.
Dogecoin price analysis daily price chart: LTC loses momentum to $0.08115
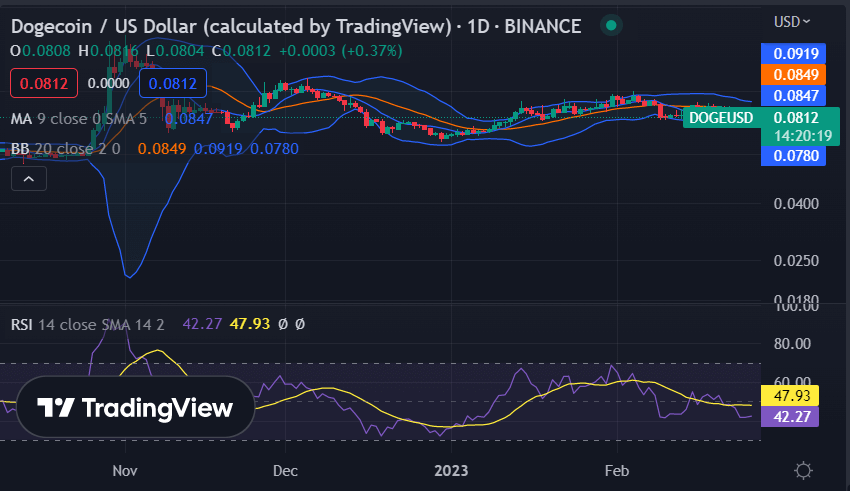
The daily chart of Dogecoin price analysis shows a bearish trend as the crypto has been trading in the red for the most part of this week. The crypto dropped to the low of $0.07755 yesterday and is currently trading near its immediate support level at $0.079065. On the upside, there is a strong resistance level present at $0.08155, and the crypto needs to break this level in order for it to go on an upward momentum.
The volatility is also low as the crypto is trading in a tight range and is likely to remain locked in between these two levels for some time. The Bollinger bands are also tightly intertwined which shows a lack of volatility in the crypto. The upper Bollinger band is at $0.0919, and the lower one is at $0.0780, which confirms the current trading range of the Dogecoin price analysis.

The Relative Strength Index has been declining as well as the indicator’s curve has reached the oversold region. The moving average (MA) value is still at a much greater position than the current price, which shows that the bulls still have an advantage over the bears.
Dogecoin price analysis: The support level is present at $0.07905
The hourly chart of Dogecoin price analysis shows the bears have retained their upper hand for the past few hours, following a downside. After the recent trend reversal, the price has decreased considerably and has slumped down to a $0.08115 low. This is quite a discouraging sign for the buyers as they have been defeated in recent hours.

The moving average (MA) value for the four-hour price chart stands at $0.0810, and the price has stepped below the MA. The upper Bollinger band is at $0.0860, and the lower one is present at $0.0790, which confirms the current trading range of the Dogecoin price analysis. The Relative Strength Index (RSI) has also been declining as it reached the oversold region with a value of 37.12.
Dogecoin price analysis conclusion
To sum up the Dogecoin price analysis, the price has shown signs of a bearish nature in the last 24 hours. The bears have been ruling the market for the past weeks, and today, a downward movement is being recorded. The coin value is now $0.08115, and further losses are expected in the near term.


