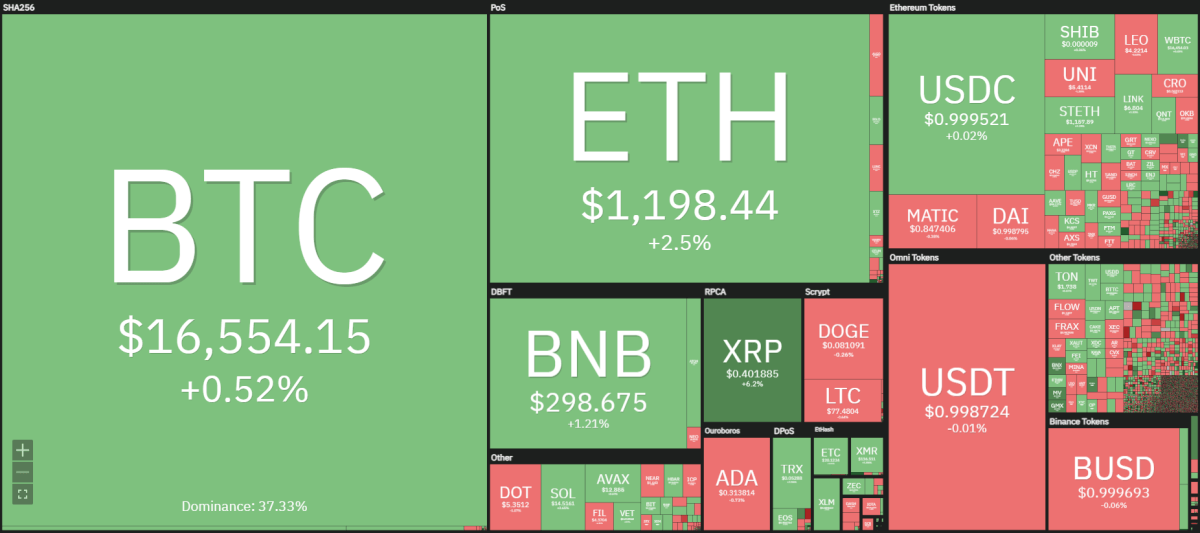
The cryptocurrency market today shows a lot of uncertainty. Dogecoin price analysis shows a loss of over 0.26 percent while Bitcoin and Ethereum are both in the green. Similarly, a few other altcoins such as Cardano and Litecoin are also reporting losses according to the crypto heat map below:

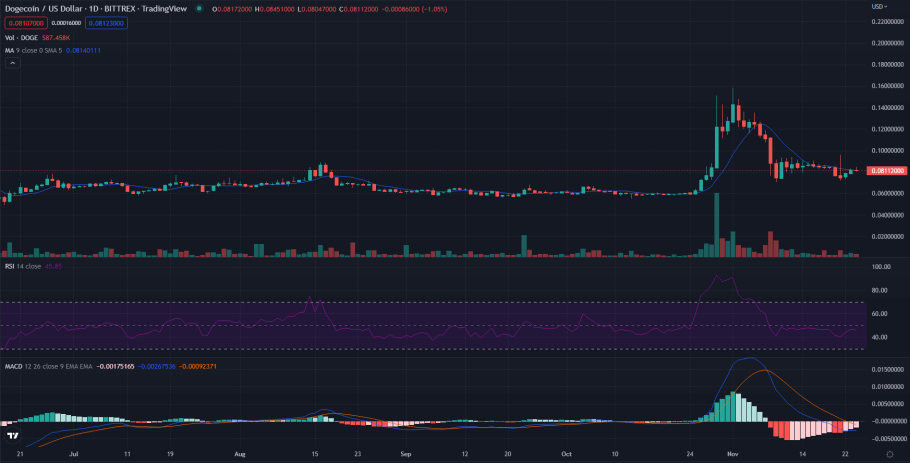
The 1-day Dogecoin price analysis shows that DOGE/USD retraced after touching the support line at $0.071 on the 21st of November. On the same day, it set a local resistance on the $0.096 mark, which Dogecoin is yet to test.

Today has been bearish for Dogecoin price analysis. Although the market has not been much volatile, the price dipped to the $0.08 mark after touching a 24-hour high of $0.0845. The RSI shows that Dogecoin price analysis is quite balanced right now. At the same time, the MACD indicator is showing some positive growth, as the strength of the negative histograms is reducing.
Dogecoin 24-hour price movement
For the most part, Dogecoin has not been heavily volatile today. It touched a 24-hour high of $0.0845 in the very first hour and since then, it has been bearish. RSI is currently at 49 on the 1-hour chart. So the market is balanced and Dogecoin is expected to consolidate sideways in the next few hours.
Overall, the trading volume of Dogecoin has reduced by 30.47 in the last 24 hours. Based on that, today’s 24-hour volume-to-market cap ratio for Dogecoin is 0.034, leaving it in the 9th market rank.
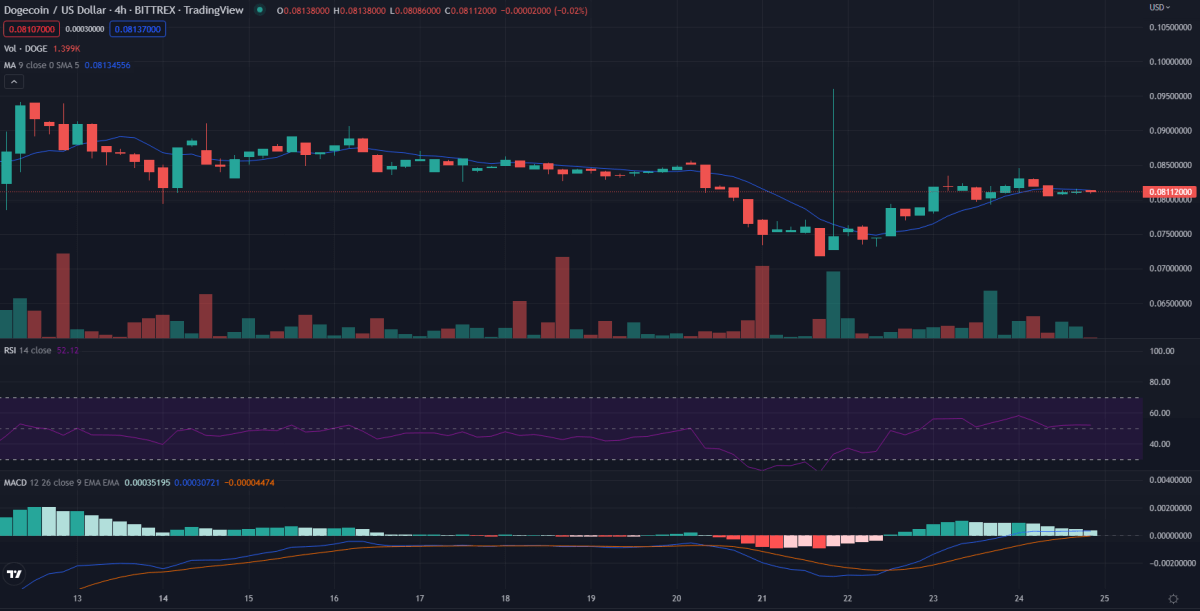
4-hour Dogecoin price analysis: Dogecoin is expected to consolidate sideways

Since the RSI is very balanced, any sudden movement in either direction is not expected. So Dogecoin price analysis is likely to consolidate sideways as it is entering a range between $0.079 and $0.0845.
At the same time, it may try to retest the support line at $0.079 over the next few intervals, as the MACD indicator is showing some negative growth. So Dogecoin is now moving toward the lower end of the range.
Dogecoin price analysis: Conclusion
Dogecoin is not getting ready to retest the $0.079 support line. It has seemingly entered a new range on the 4-hour chart. So, the next couple of hours are going to be bearish and its price is expected to dip a little. Based on this analysis, this may not be a good time to buy Dogecoin for short-term profit. A good time to buy Dogecoin would be near the $0.079 mark.
While Dogecoin price analysis determines its course, consider reading our detailed price predictions on Chainlink.
Disclaimer. The information provided is not trading advice. Cryptopolitan.com holds no liability for any investments made based on the information provided on this page. We strongly recommend independent research and/or consultation with a qualified professional before making any investment decisions.


