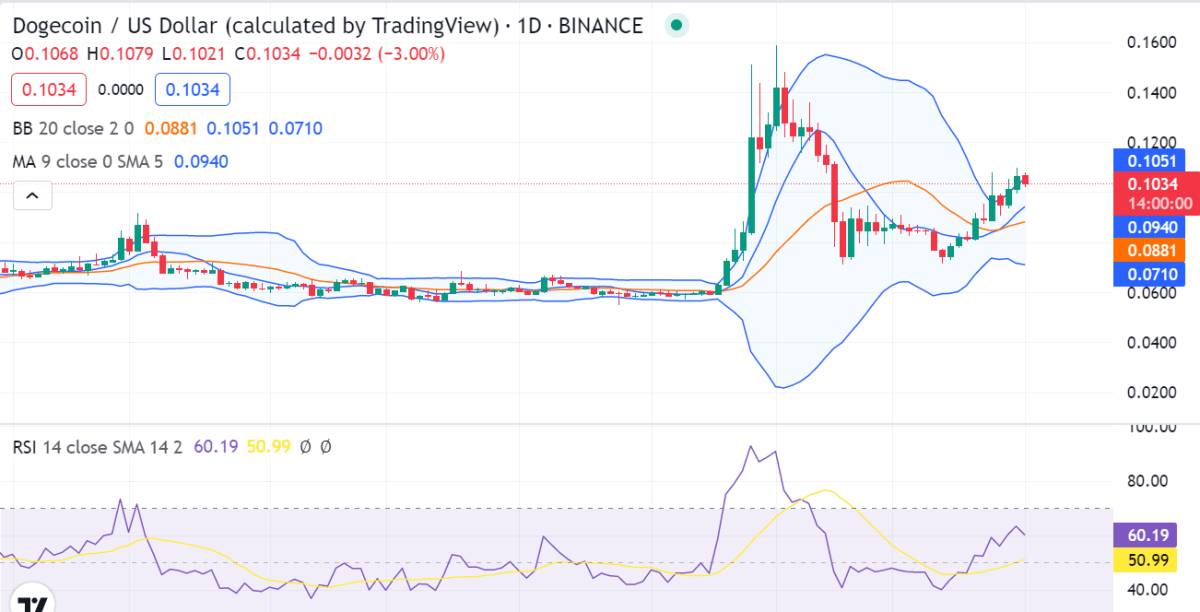
Dogecoin price analysis reveals a bearish trend, as a steady decrease in price has been detected today. The most recent analysis shows that the cryptocurrency is covering the range downwards again as the selling pressure has returned in the market. This has caused the price to reach down to the $0.1029 level. The next support is present at the $0.1003 level and the DOGE/USD pair resistance is currently at $0.1089.The 24-hour trading volume for DOGE/USD has dropped by 16.41% and is currently at $1,125,826,925, and the market cap is at $13,682,511,421.
DOGE/USD 1-day price analysis: Bearish dynamics dip Dogecoin to $0.1029
The 1-day Dogecoin price analysis indicates a further decrease in the prices has devalued to $0.1029 at the time of writing. The market volatility follows a declining movement, resulting in the cryptocurrency being less prone to volatile change on either extreme. The Bollinger band average is now at $0.0881, whereas the upper Bollinger bands value is at $0.1051, and the lower Bollinger bands value is at the $0.0710 position.

The Relative Strength Index (RSI) score has also decreased to the index of 50.99 after today’s downtrend; the curve of the RSI indicator shows that the action is heading downwards today due to the selling activity in the market. The moving average (MA) has also been hovering at the $0.0940 level below the price.
DOGE/USD 4-hour price analysis: Latest developments
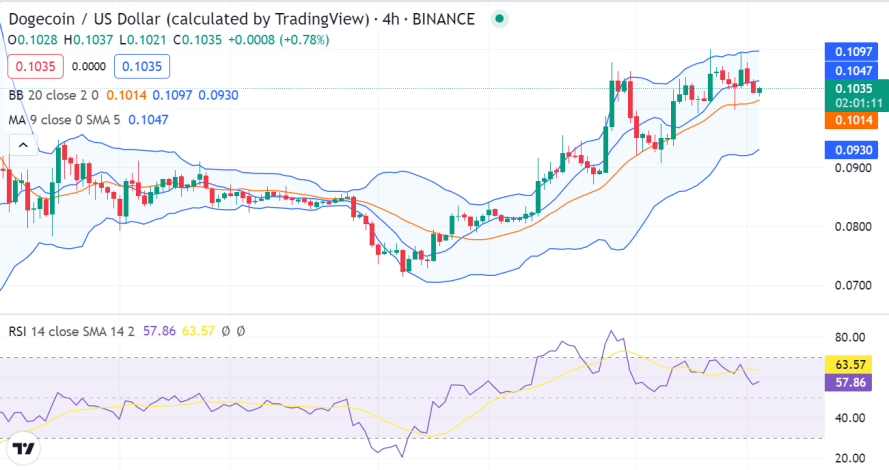
The 4-hour Dogecoin price analysis shows a deficit in the price levels as the bears have regained their strength. The price has stepped down to $0.1029, which is surprising for the buyers, but the coin was under bearish pressure from the start of the day; however, the coin has found support just recently, which has prevented the price levels from falling exceedingly low.

The moving average (MA) value of $0.0940 is above the Bollinger band mean average line, which is forming at $0.0881, as the bears have taken the price below both the averages, and the Bollinger bands have started to show signs of convergence, with the upper band at the $0.1051 mark, and the lower band at the $0.0710 mark. The RSI indicator for the DOGE/USD pair is currently at 63.57, which indicates that the market is overbought at the moment.
Dogecoin price analysis conclusion
The 1-day and 4-hours Dogecoin price analysis indicates that the bears are controlling the market, and they have decreased the price levels to $0.1029. Further decrease in cryptocurrency’s price can also be expected as the support is still further low at $0.1003.
Disclaimer. The information provided is not trading advice. Cryptopolitan.com holds no liability for any investments made based on the information provided on this page. We strongly recommend independent research and/or consultation with a qualified professional before making any investment decisions.


