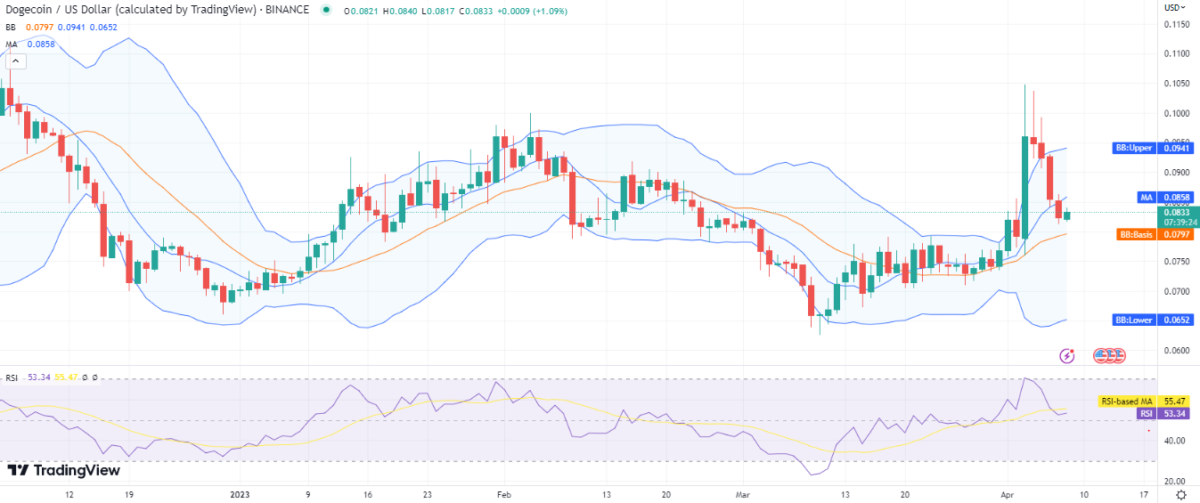
The Dogecoin price analysis shows that the cryptocurrency is recovering from the heavy loss, but despite repeated tries to recover, the price has hardly reached the $0.0833 mark. The cryptocurrency spiked high on April 3, 2023, to $0.0961, with a brief spike towards $0.1050. The coin retraced downward for the next four days consecutively, and today, the support appeared at the level, where the coin was trading before the high spike.
DOGE/USD 1-day price chart: DOGE bulls hang on to $0.833 as they lack momentum
The 1-day candlestick chart for Dogecoin price analysis shows a bearish momentum for the past four days, but today’s trend is different as support has arrived. The recovery in price level is not sufficient, but at least the coin has maintained its previous value, which proves that support is quite strong below the current price level of $0.0833. The coin has gained a minimal 1.05 percent value over the past 24 hours, and it has gained a good 7.22 percent value over the past week, as the trend was upwards before the high spike of April 3.

On the 1-day chart, Bollinger bands are showing strong resistance at the $0.0941 mark. The lower Bollinger band value stands at the $0.0652 mark, representing the strongest support. Considering the current scenario, the volatility for the cryptocurrency is seen to be quite high on the 1-day candlestick chart, which is a promising sign for bullish momentum.
The relative strength index (RSI) score is standing at 53, with an upward curve hinting at the buying momentum in the market. Previously, the RSI curve was downward after touching the border of the overbought region. On the other hand, the moving average for the Dogecoin price is showing a value of $0.0858.
Dogecoin price analysis: Recent developments and further technical indications
The 4-hour Dogecoin price analysis shows a weaker bullish trend on the price charts. The price breakout was upwards today, and the coin showed good progress during the first four hours of the trading session. There have been some slight corrections and a few bullish bursts, but not much movement in the price game.

The Bollinger bands are showing increased volatility for the cryptocurrency. The indicator shows that the cryptocurrency is facing resistance at the average value of $0.0867, and the indicator has also taken a downward breakout, which is a bearish sign, but that is due to the previous bearish trend. The relative strength index (RSI) is showing a score of 40, which shows a balance between the buying and selling activity.
Dogecoin price analysis: Conclusion
To conclude the Dogecoin price analysis, we must look at the 4-hour and 1-day charts that are showing promising support below the current price of $0.0833. However, the weaker bullish momentum and current sideways price movement hint at the fact that strong resistance is also present above this level, and the DOGE price may close near the current price level today.


